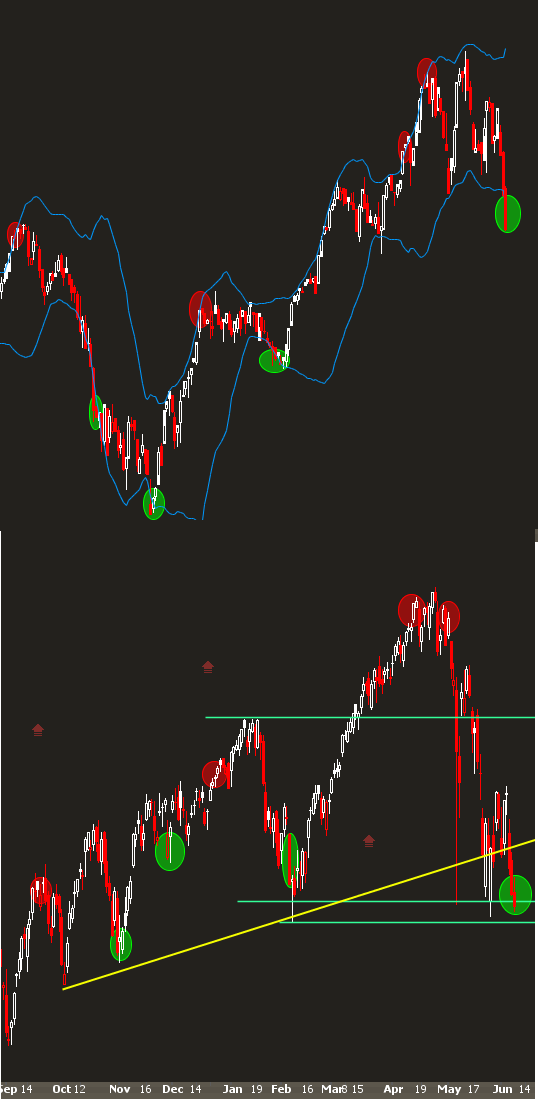
Trading strictly off oversold indicators is a bad idea. I think it's best to keep an eye on them to see where we are in terms of extremes, but we can stay oversold longer than you think.
But they're nice to observe, and it gives me something to do so I don't overtrade. Here's a new indicator to watch.
The chart below is the performance of IWM relative to SPY. Today we saw largecaps up big but the Russell significantly underperforming. When we see that happening, usually that means the appetite for risk (beta) is waning. When that sort of risk appetite reaches extremes, you end up with overbought and oversold readings. We simply use a 20 period Bollinger band to eyeball those extreme levels, and they have matched up fairly well over the past 9 months.
Do note that there is hindsight bias here and is in the context of an uptrend that may have changed. This is an art, not a science, but it gives you an idea on how the market is currently perceiving risk.
