I've been talking a lot about how options are really, really cheap right now.
And to be fair, it makes sense. The S&P is in the tightest range we've seen in something like 20 years, so the options market is responding in kind.
But we're starting to see an overshoot.
Take Google Alphabet (GOOG) for example.
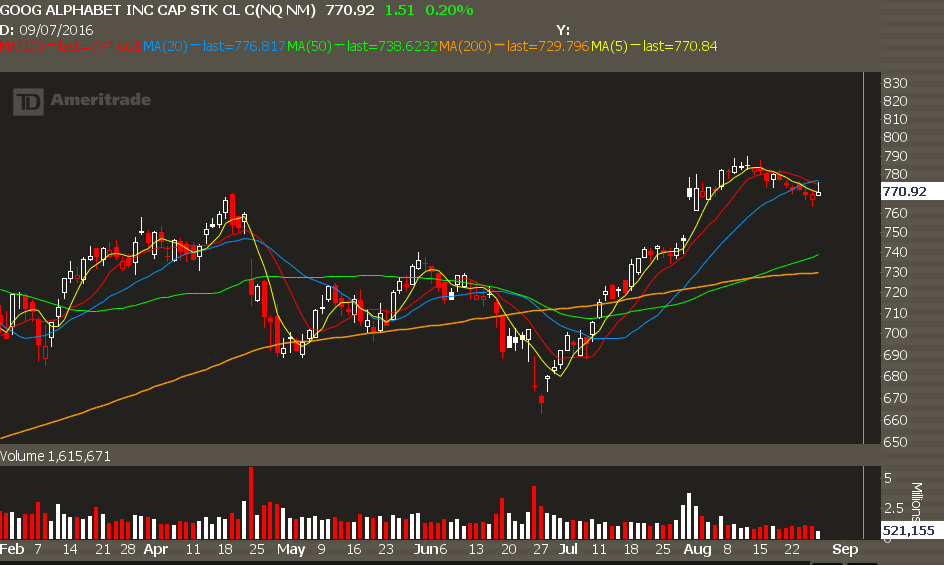
The stock had a nice pop on earnings, and really hasn't gone anywhere over the course of a month.
What's the options market telling us?
One quick way to measure the volatility in the market is something called "price over strike."
We take the price of the straddle and divide it by the strike price of the straddle.
The Sep 770 straddle is going for $19.
That gives us a price over strike of 2.4%.
What does that mean?
If you buy this straddle and GOOG moves at least 2.4% by Sep opex, you're going to make money.
Show Me The Odds
You may ask yourself...
Well, how often does GOOG move 2.4%?
I've ran the numbers.
Looking at a 10 day trading window... so not even 20 calendar days but 14 calendar days, this is what I see:
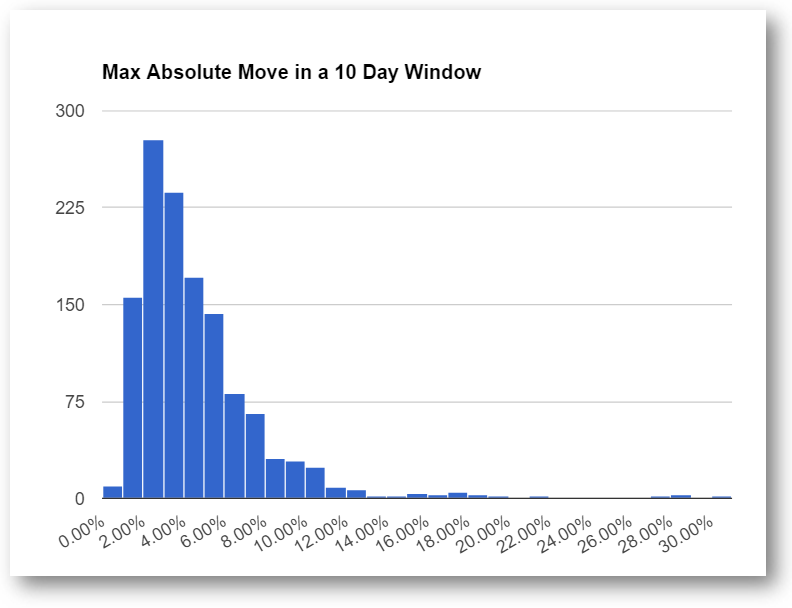
Here's how I got this graph...
I looked at the maximum gain and maximum loss of any time during that 10 day window... and took the largest of those values.
Clearly, GOOG moves a lot more than 2.4%.
How much?
This sample is over a 5 year window... I've got 1,248 samples.
The number of times over 2.5%?
933.
That means you've got a 75% chance that GOOG moves more than 2.5% in a 10 day window.
It's not just slightly better than a coin flip... it's a flip and a half.
I don't recall many times when the options market skews the odds this far into the option buyer's favor.
Pretty good odds, don't you think?
If you want to see how I'm trading this, come join us at IWO Premium. 14 Day Trial for only $14.