When you're following any kind of trend, a major issue is trying to figure out when to get out of the trade.
The question is: when does the trend break?
And guess what: no easy answer here. But it helps when you put the question in the context of volatility.
There is a fun little word in the risk world.
This word is big and angry and complicated.
Are you ready?
Heteroskedaticity.
And no, I've never spelled that word right in my life. And I use a "k" where I should use a "c."
What this word means is that volatility is not evenly distributed. Volatility tends to cluster.
We know this by intuition. When a stock sells off, boy can it selloff.
So to find stocks that are in the midst of "breaking," we can look for volatility events to give us very early warning signs.
Let's take a look at a current example in Visa. The lower study code can be found here.
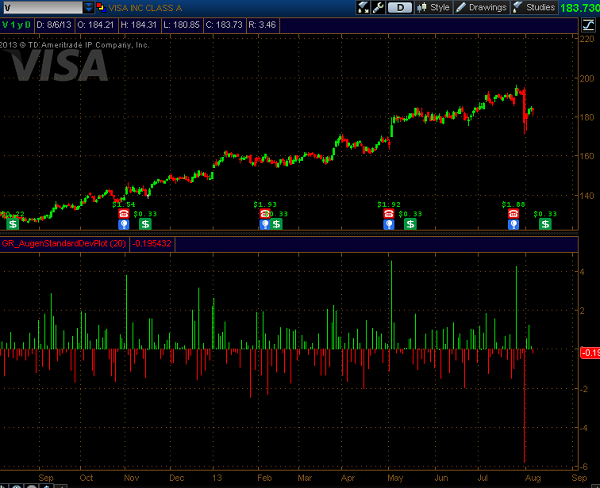
The study shows us the current day's move relative to the previous month's volatility. When we see large spikes, it means that the day's move was much more volatile relative to "normal."
A few days ago, Visa's stock moved over 5 standard deviations lower. This definitely classifies as a volatility pivot, and odds are much higher for further volatility, including a break in the long term trend.
Does this mean the trend has to end? Not necessarily. But it tells me that the simple trend-following edge is no longer there and you need to adjust to the new risk and new volatility.