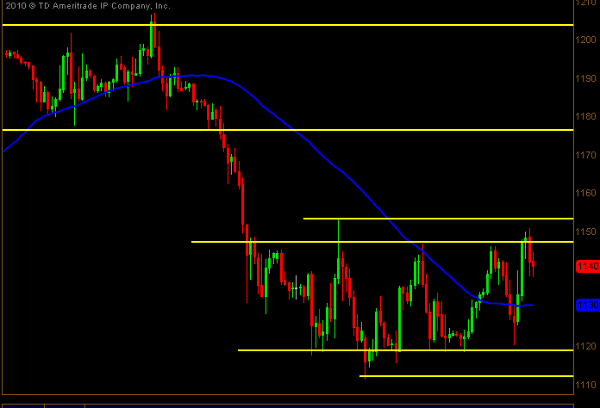
This chart explains it all:
Hourly GLOBEX chart for the $ES_F.
The market is rangebound within clear support and resistance parameters. As we get to the extremes of this range, we see the market fade back to the mean.
And even though volatility has died down, the fear/greed cycle seems to be amplified. Everytime we turn green or red, emotions flare up. This is most likely due to the enhanced financial newsflow out to Joe Retail right now.
Depending on your bias, you could see either a basing pattern or a bear flag-- I'm leaning towards the former.
Until there is evidence that we are actually resolving out of this pattern, it's best to assume mean reversion on strong moves.
Tags: $SPY $DIA
