I need to get this off my chest.
Stop being a bunch of drama queens.
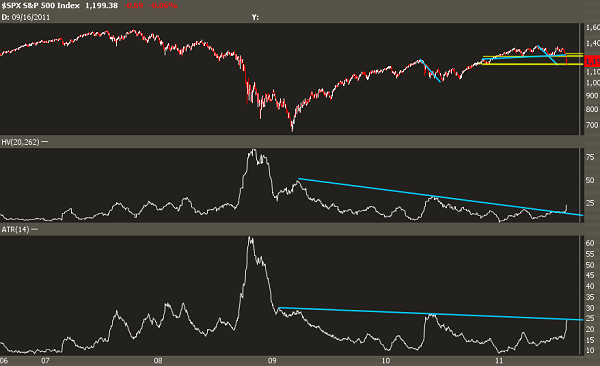
You want to talk about panic? The chart above shows the 20-day historical volatility and the 14-day average true range going back to 2006 on the $SPY. You could do the same analysis for $DIA, $IWM, $EEM, or $FXI.
See where we are now?
See where we were in 2008?
This newsflow and volatility is clown shoes compared to what happened back then.
Of course, you can take this two ways, depending on your bias. If you're bullish, you just say this is a small hiccup in the grand scheme of things and the overall trend is up.
If you swing the other way, then you can say we've only just begun and it will get a lot worse. You probably have a unibrow, too.
Me? I'll put on my mean-reverting hat, as painful as it is-- but I expect the trend has changed from neutral to down.
Do you know who's winning? The owners of CPM-monetized websites.
