 After equities got Egypped, it seems that the markets are back to the same intraday snoozefest that has occurred over the past few months. But can we expect any sort of turnaround in volatility? Let's take a look.
Our Volatility Chart
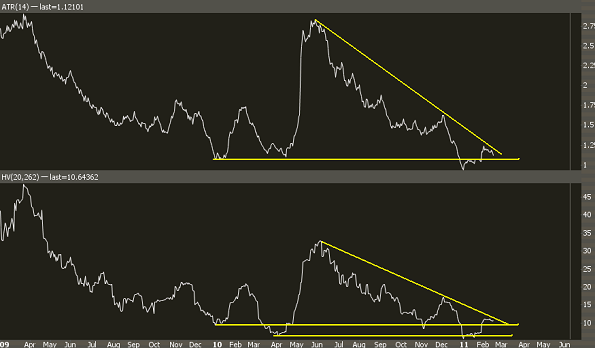
We're going to look at the SPY average true range (ATR) and the 20-day historical volatility. The former shows intraday volatility but doesn't include gaps; the latter takes into account market gaps but is on a close/close basis. Combining the two makes for a very nice volatility outlook:
 As you can see, volatility has been in a steady decline since the flash crash summer levels, and the market vol is now back to levels in which the drop in volatility found "support."
Do note: there is a natural downside limit on volatility. Unless the markets cease to operate, volatility will never go to zero. However, there have been times in which intraday volatility can be nearly wiped out of the market. For example we currently see a HV of about 10.5, but in late 2006 we saw single digit readings persist.
A Vol Bottom?
Now that chart above does lead me to believe that we could be ready for some increased volatility but the problem with vol is that it is usually inversely correlated with equities-- that means wider price swings occur during bear markets and downtrends. So for me to call a bottom in volatility would essentially be me calling a top in equities, which is not something I am willing to do at this point.
So for now, I think that blanket volatility selling is a tough proposition here, and it might make sense to hedge with some OTM put calendars or some other long vega position (if you don't understand what I just said, get some schooling here). But as for "nailing the bottom" in volatility, I will wait for a confirmation in price.