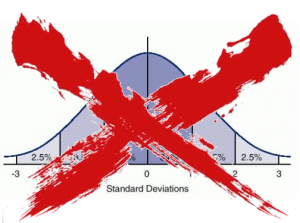
It's dangerous.
It blows out accounts.
And you've gotta see the massive blindspot that option "gurus" are avoiding when they talk about this statistic.
Sure, it makes sense when you look at the fancy charts but once you put it into practice, you end up with one or two bad trades that ruin your month or potentially your year.
Let's break down this misleading statistic and what you can do it.
The Basic Idea Of Option Selling
Before I start... I'm a huge fan of being a net seller of options. You can earn a stable, consistent profits with income trading.
Yet I know that they can be pinless hand grenades if I'm not careful.
Here's how the bad statistics get started...
There's something called "persistent risk premium."
Basically, the options market tends to overprice risk. That's because there will always be more institutions looking to hedge their bets than there are people on the other side willing to take on that risk.
It's where we earn our profit as option sellers.
Now the way we measure risk in the options market is implied volatility. It's the expected standard deviation of the market.
And the way we see what actually happened in the market is historical volatility. It's the actual standard deviation of the market.
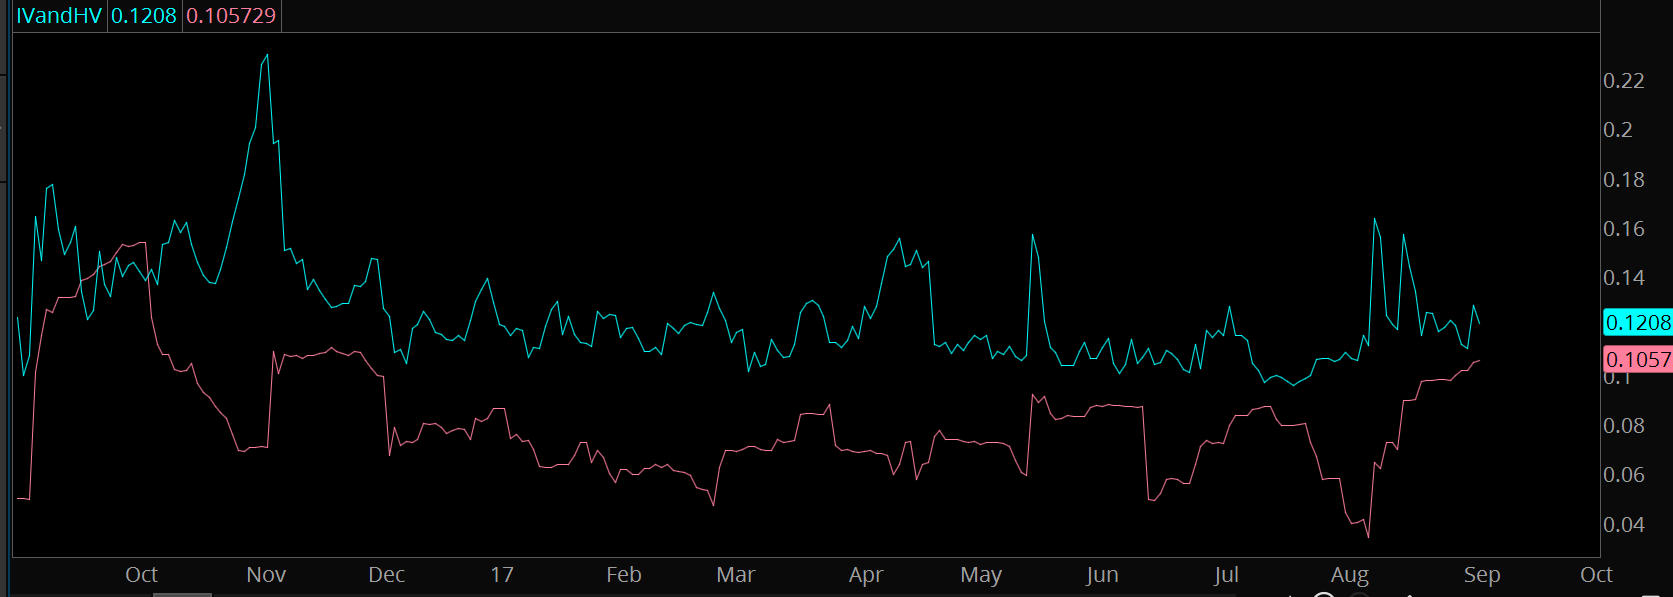
Here's a chart of the IV and HV of the S&P 500 options market:
If you'd like this custom study for thinkorswim, get my thinkorswim secrets here.
As you can see, the implied volatility (blue line) tends to be much higher than the historical volatility (pink line).
That means option selling will work right? Easy peasy?
How You Could Get Smoked By Blindly Shorting Options
Let's say you're a true believer in selling vol. That the premium in the options market is higher than the actual volatility in a stock or market.
Here's a question for you...
Is it possible for you to be right and still get blown out of a trade?
Allow me to show you an example.
Here's AAPL. The stock reported earnings and had a nice gap up. It then saw what we call PEAD, or post earnings annoucnement drift:
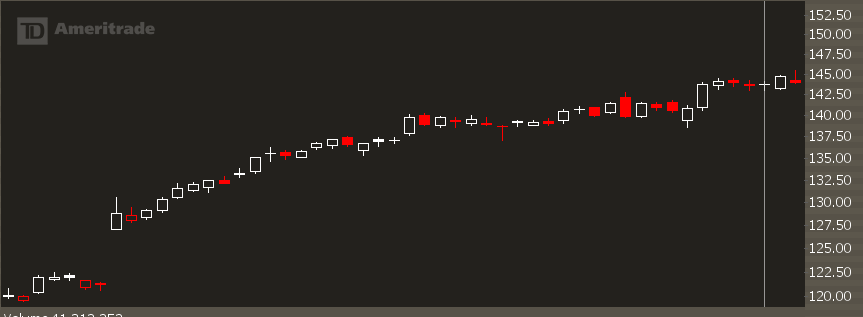
The stock rallied from 130 up to 145 over the course of a month.
Going back and looking at the options, the implied volatility after the earnings was just a bit above 17%.
And during the trading after the earnings event, the historical volatility never broke 12%.
Obviously, selling options was a good bet... right?
Not so fast.
The at-the-money straddle was pricing in about $5 worth of movement either to the upside or downside.
Over the course of about a month, the stock moved twice that. Shorting volatility would have been a huge loser.
That's right, even though the stock volatility stayed low... you would have been run over on many short volatility trades.
What gives? How can this even be possible?
It's because the option selling true believers forget to mention one thing...
The Missing Piece Of The Puzzle
Markets move in cycles. I've written about market cycle theory before, but here's the cliff notes...
You have 3 cycles:
Price, Momentum, and Options Premium.
The relationship is this:
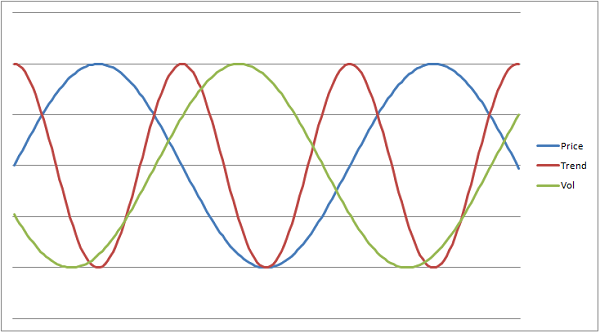
Generally, when stocks are selling off, option premium goes higher. And when stocks rally, option premium goes lower.
So here's where the statistics screw up...
When you look at volatility readings they are de-trended. The direction of the stock or market is not taken into account at all.
In fact, there's two kinds of historical volatility you should keep an eye on:
- Trending Volatility
- Reverting Volatility
Take a look at this market rally as an example...
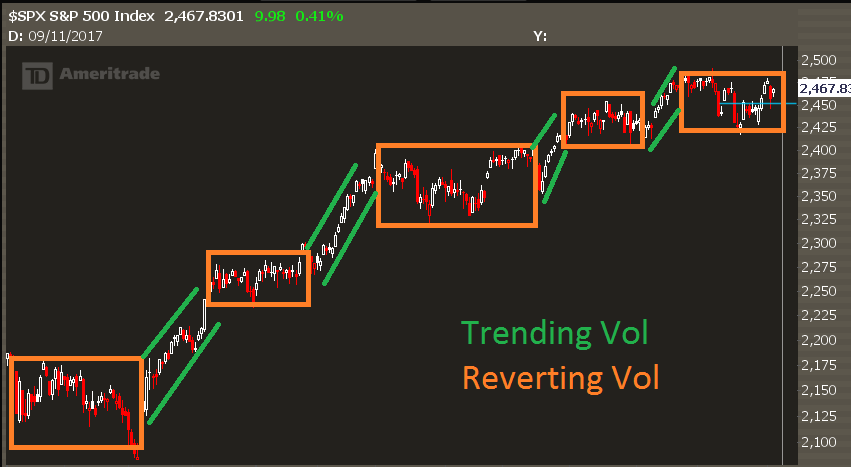
Let's extend it a little further into auction market theory.
When the price of an asset is accepted, it will oscillate around that accepted price until either buyers or sellers run out.
Once liquidity dries up, price will auction either higher or lower until a new accepted price is found.
The kind of price action we see will cycle between reverting and trending volatility.
Make sense?
It comes down to this-- comparing HV to IV ignores the most dangerous part of an income trade-- TRENDING volatility.
You Have To Adapt
Over the past decade I've worked with investors and traders to get better at options.
Many times, people will come to me with the same kind of story...
- I found a new magic button called "option selling."
- When I press that button, money comes out.
- That magic button worked for about 3 months, then I lost all my profits on one bad trade.
That one bad trade?
It comes from trending volatility.
I'm not here to say option selling is a terrible idea.
I'm saying option selling with no risk management plan is a terrible idea.
In other words.
Income Trading is Not A "Set And Forget" Strategy.
This is not an easy-bake oven.
Most of the time, markets see more reversion than trend. So yeah, you'll see some nice, consistent profits come in.
Whether or not you're successful is how you manage your trades when trending volatility comes into play.
I don't care how you manage them... just have a plan in place. Roll, hedge, close.
My favorite kind of income trade is an iron condor.
And just like any other kind of iron condor, they can get in a lot of trouble if trending volatility shows up.
In your free Iron Condor Toolkit, you'll get a pdf case study showing exactly the kinds of adjustments to take if the market starts to move hard against your position.
Because most of the time this trade is a layup. Consistent, easy profits.
Whether you're profitable at the end of the year comes down to how you manage the tough times.
If you want to see how to earn a better trading income, get your Iron Condor Toolkit here.