• Skip to primary navigation
  • Skip to main content
  • Skip to primary sidebar

Investing With Options

Become a Better Options Trader

The Running on Fumes Chart Pattern

March 4, 2010 By Steven Place

This is a pattern that pops up every once in a while during the opening session. It's actionable and fairly reliable-- and most importantly, it's undersubscribed.

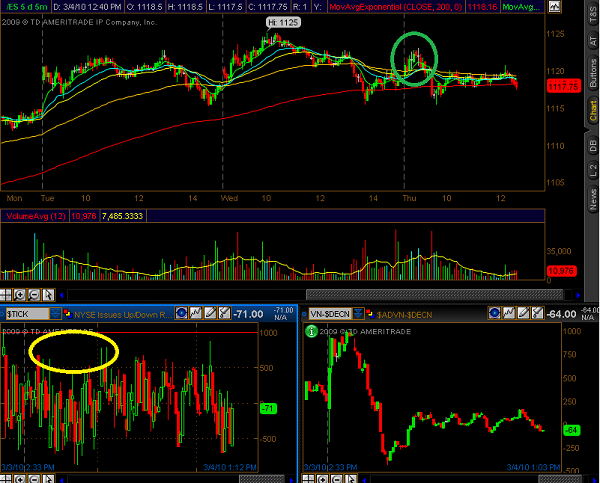
Here's the pattern:

This pattern requires a little more context. First, we're near the top of a potential trading range and have made lower intraday highs over the past two days.

This pattern only happens at the open, and it shows when the market is "running on fumes." Essentially if we are getting a runup in futures but it's not confirmed by the underlying markets, it is fadeable. This confirmation can be seen by looking at a basket of heavily traded names, or by looking at the TICK readings (yellow circle). If we don't see extreme positive TICK readings, it's time to be very skeptical of the upmove.

So when does the market fade? Well, the market structure generally changes around 10AM EST as different participants come into the market. The "10AM Turn" is quite reliable as a pivot point.
Free Iron Condor Toolkit

Want to learn how to beat the market without needing to time the market?

Do you desire a way to earn aggressive returns without staring at screens for six hours a day?

Get this free iron condor toolkit that will show you how this trade works in the real world.

Download the Toolkit Here

Primary Sidebar

Resources


Option Trading Basics
Income Trading

Recent Posts

  • IWO Live – May 21st – The Market Refuses to Die: Why Sticky Bids, Gamma Squeezes, and Degenerate Trades Are the New Normal
  • How I Profited From A One-Day Pullback In Tech Stocks
  • 3 Option Trades for CCIV
  • Time to Call a Top in Solar
  • Winning In Both Directions

Get The Options Trading Training You Need.

See All IWO Trading Courses!

© 2023InvestingWithOptions | Disclaimer | Financial Disclaimer | Terms and Conditions | Privacy Policy