It's absolutely heretical to oppose the cult that Jobs built. And there's a good reason-- the development of solid products and the growth that has followed over the past few years has been unprecedented for a company that large.
So for me to go out and issue warnings with respect to technical structure, it must be given a grain of salt as it is countertrend and not necessarily actionable.
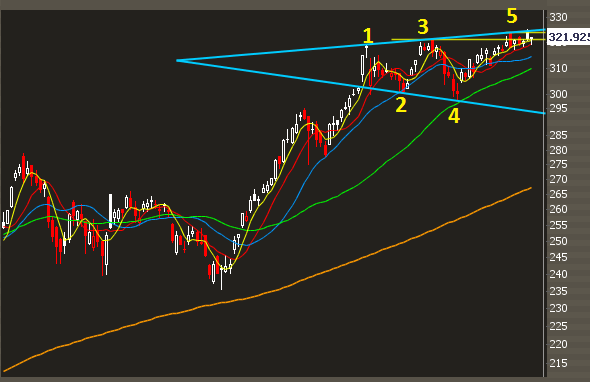
The pattern I'm looking at is a reverse symmetrical triangle, also known as a broadening top. The pattern makes higher highs and lower lows, indicating a slight break in trend and some instability as seen by the volatility.
Here's the chart:
While I wouldn't trade this pattern in and of itself, it should be taken into context. If we start to see price confirmation, we could easily see a move to the mid of the triangle, about 10 points lower, which would coincide with the 50 day moving average. On a shorter term timeframe, we've seen two recent gaps up into all time highs that have failed, indicating selling at those levels and a waning of breadth. There are also divergences with respect to momentum and other oscillators, but those are second derivative indicators and I would focus solely on price.
And just like other bearish patterns, they can fail. Playing the failure of bear flags and head and shoulder patterns have been very profitable this year.
So I think I've said it as nicely as I can: the market structure is weakening on AAPL and it may be time for a deeper pullback. The torches and pitchforks can be found at the back of the room.

