 Can you hear that sound?
It's getting louder.
It's the momentum freight train...
... and you're standing on the tracks.
One of the problems with being a contrarian trader is that market trends can go for much longer than you think.
So if you're trying to short a high-flying stock because it's "up-too-much," you will often get runover by that freight train.
But I'm going to show you a method that gets you in only at the best times, using a simple options trick.
This trade tactic will keep you from blowing out your account on a "cute" short, as well as give you a new tool to use when looking to short momentum.
What Parabolic Means
When a rally in a stock or market accelerates, it means that the rate of change is increasing.
We can model this by thinking that the chart looks like a "parabola" with the inflection point higher than the current price.
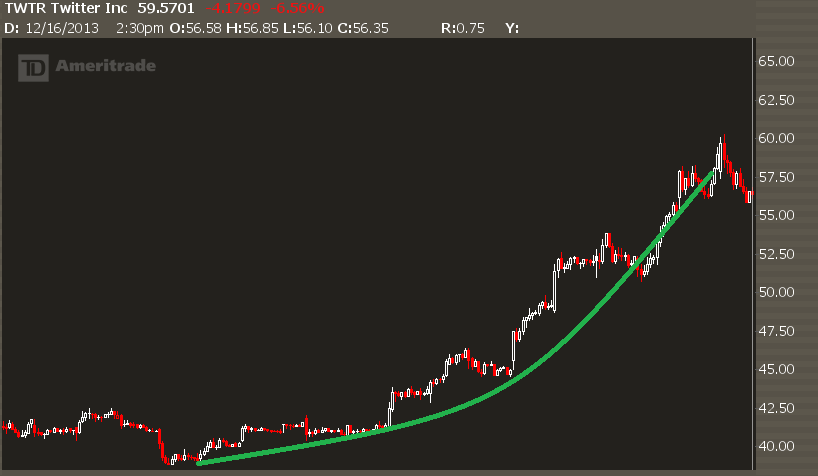
We can model this by thinking that the chart looks like a "parabola" with the center higher than the current price.
Parabolic moves mean that fresh buyers are coming into a stock, either on the back of news or perhaps just strictly on price action.
And they aren't sustainable... but they can go a lot higher than you think.
Using Options to Get and Edge
Enter option skew.
This is a visualization technique that looks at the implied volatility of different options to see where the demand is.
A normal skew has a negative slopw-- that means out of the money puts will have a higher implied volatility than out of the money calls.
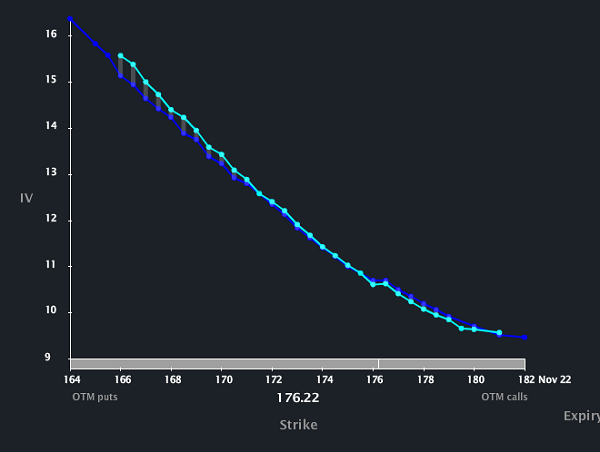
And that makes sense. Investors are willing to pay higher relative price for downside protection, because that's where the fear is. 90% of market participants are long-biased so downside action is "bad" for them.
But when a stock goes parabolic, the psychology changes.
This is when we see traders not scared of losing out, but missing out.
And the perception of risk shifts to the upside.
Degenerate Option Buyers
With the fear of missing out, many traders will turn to options.
Specifically, they will buy upside calls in order to profit on increased upside movement, and using leverage to get higher returns.
This demand shift in those calls is what changes the option skew. It can either shift to a positive skew, or it can turn into a "smile."
Here's a recent example in TWTR:
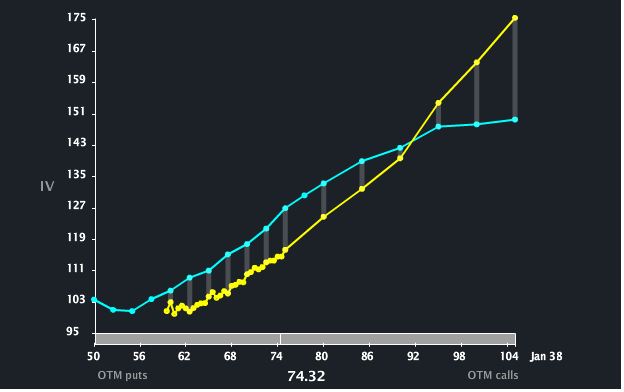
When you start to see a volatility curve like this, it means there are a ton of call buyers out there. Late money. Panicked money. Fear of missing out money.
When we finally see that true "panic" during a parabolic move higher, that often indicates trend exhaustion and the stock is ripe for a pullback.
In 2013, we saw this occurrence in many high beta tech stocks - TWTR, FB, AAPL, TSLA, and NFLX.
How to Play It
Sometimes a simple short stock is the best play, but you often get better risk and reward by structuring option trades.
One idea is to sell a call 1x2, which is bearish stock, bearish vol, and bearish upside skew. So if the stock pulls back and the skew normalizes, you can get a better position.
Another trade would be a strangle buy with a call sale kicker. This gets you long volatility on the at-the-money contracts, while the pump in IV on the out of the money gives you a good way to reduce the overall cost of the trade.
Finally, for the bold, weekly put buys can work but only on super aggressive timeframes and risk management parameters.
Like this analysis? Check out IWO Premium, our trade service featuring nightly videos, trade alerts, and a chat room full of experienced option traders.