While most technical analysis is concerned with the direction of the trend and potential turning points, analysis of volatility is critical especially when trading options. Remember, in equity options there are two sources of supply and demand: direction and premium. So while we do have to figure out where the stock is headed, we also have to discern how long and how fast it will take, as we can structure option trades around that thesis.
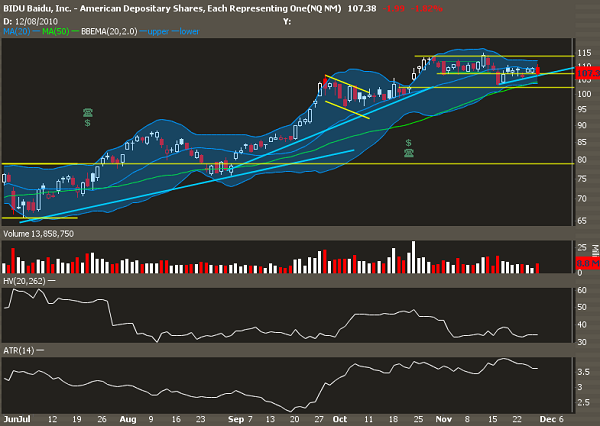
Here's my vol chart of BIDU:
The first thing to look at is the Bollinger bands, highlighted in blue. The BB is an adaptive volatility study, which gives you an idea of potential price targets as well as a measure of how volatile the stock has been in the past. We can see that the band is "pinching," which indicates that nothing has happened over the past month. This is normal for stocks-- often you will see a large shift in supply and demand from an event, then a rest as everyone agrees on price. After that rest, the equilibrium will get out of balance and it will move to different prices to attract supply or demand.
But what's interesting here is that other vol readings haven't dropped off in this consolidation. The 20 day HV is still fairly elevated, and the ATR (average true range) really hasn't fallen off. So while we've consolidatd on a daily chart, intraday volatility remains high, which indicates some instability and possible distribution.
So while the overall outcome of the future in BIDU remains uncertain, I'd watch for a strong volatility move in the near term future-- that means I would be a net buyer of options, looking for confirmation of a break either way.
