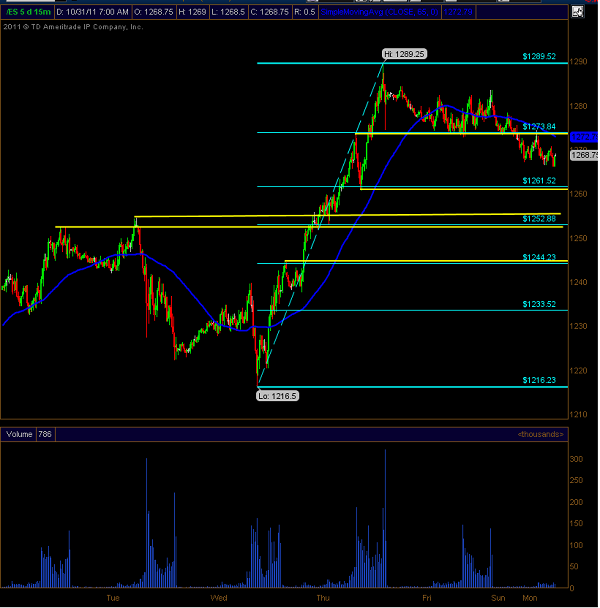
The chart below is a 15 min globex session of the $ES_F:
Clear support and resistance levels are highlighted in yellow, and a fibonacci retraceament from the lows on Wednesday to the highs on Thursday are in blue.
You can see how the price levels coincide with the fibonacci retracement levels. When several technical indicators line up areound the same prices, it is known as "technical confluence" and can reinforce the market structure around these levels.
I am using these levels, along with daily pivot points and volatility readings to help my trading this week.
I'm expecting fewer trend days as bulls and bears process through the price action from last week, which should be considered constructive price action unless proven otherwise.
