Good Lord... the financial markets have a short memory.
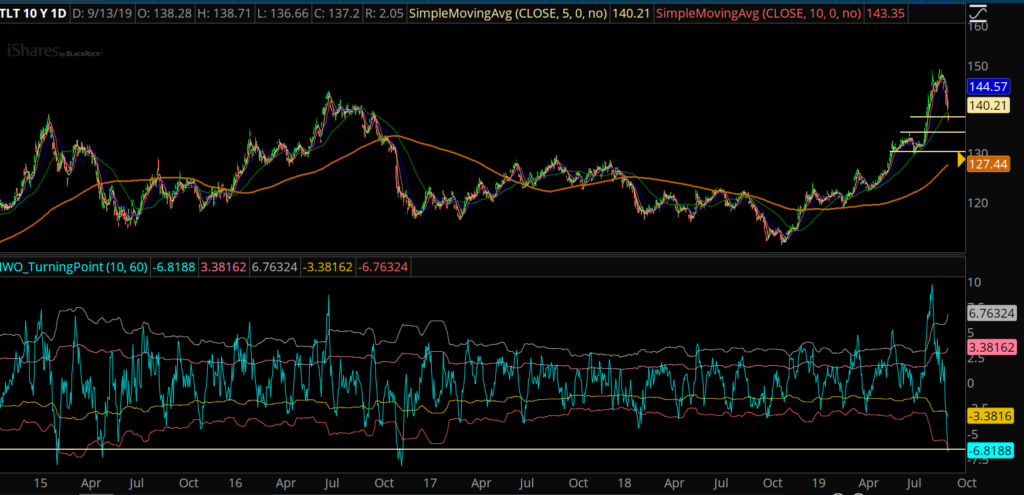
LESS THAN A MONTH AGO, the long bond went parabolic.
TLT ran up nearly 10% in 10 days.
Largest rally since the Fiscal Cliff play in 2011.
When TLT goes up, it means that rates went down. And rates got low... stupid low... it felt like a deflationary vortex with the trade war and China adjusting their currency and emerging markets collapsing.
LESS THAN A MONTH AGO!
Now where do we sit?
US stocks are up near all time highs, emerging markets ripped...
And TLT is facing the worst 10 day selloff in years. Down 6.8% in 10 days.

There have been 3 other instances in the past decade that have been worse than this.
How's that for a round trip?
What The Heck Just Happened?
There are other forces at play here that are NOT fundamental.
And I think one of the bigger drivers of this selloff is risk parity rebalancing.
To keep it simple, Risk Parity funds are long stocks and long bonds. And when the value of one exceeds the other, then the fund will rebalance the portfolio.
So when you have stocks down and bonds up over 10%... it creates a self-fulfilling feedback mechanism that causes reversion.
And this is so well known that you'll have traders front run this trade so it starts to get priced in faster than the funds can rebalance.
This feeds on itself and all of a sudden you have the worst selloff in a long time.
What a round trip!
It's Time To Nerd Out.
We're going to go down a "mad scientist" rabbit hole. Math will be involved. Yet if you can get through it and finally understand it, you'll get an insight into how I approach options trading a little different than most.
Ok let's start out with the OddsMaker. This shows us the returns distribution for TLT:

This shows you the 10 day returns distribution for TLT. Here are the stats:
Average: 0.16
Standard Deviation: 2.5%
To translate this out of nerd-speak...
Having a -6.7% selloff is a big move. Very big move. Doesn't happen very often.
You could even call this "oversold."
Here's the other cool thing, because this is one of the ways I pick out a trade setup.
Let's look at the 20 day returns of TLT:

The stats:
Average: 0.33%
Standard Deviation: 3.61%
That means a 2 standard deviation move would be around -7%... over a 20 day timeframe.
The other cool statistic?
Out of all the trading in TLT, it has sold off more than 10% just 0.18% of the time.
Let's see where a 10% selloff in 20 days would put us:

So right around 133.
Now we know, from past trading, that it's pretty rare for TLT to selloff 10% in 20 days.
It's already sold off 7% in 10 days.
What are the odds that the options market is pricing in?
Let's take a look at the monthly options that expire in 7 days...

The 133 put has a delta of 11, meaning that the market is pricing in about a 10% chance of expiring under that price.
I know we just went through a bunch of complex math, but I want to ask you...
ARE THE WHEELS TURNING IN YOUR HEAD???
Yes, this is "mad scientist" stuff but let's try to keep it simple... again.
There are VERY FEW instances in which TLT has managed to tank 10% in a 20 day window.
TLT has already sold off 7% in 10 days.
The market is pricing in 10% odds that it will happen in 7 days.
Connecting the Dots?
It's very probable that the market is overpricing downside risk in TLT options.
That's where you can find an edge.
Coupled with some simple technical analysis... Yes, previous support is potential resistance... Then you've got a real edge.
Of course it's possible that the bond market completely crashes. That's the risk. Yet if you think the potential rewards you receive are better than the implied risk in the market, you gotta put on that trade every time.
For me, I think using short term options could be a little tricky here. I'd rather go out to October and start scaling in.
Do You Like This Kind of Trade Setup?
If you managed to make it this far, then you're motivated enough to build wealth in the options market.
IncomeLab can help you find the best trade setups. Get started for $99 per month.