All eyes seem to be on the $VIX as near term investors are looking to see whether volatility will start to see a bid.
After all, volatility is oversold, right?
Right?
Not so fast.
What Are You Measuring?
When you want to get a feel for volatility, you have to look at implied as well as realized.
Here's a look at 20-day realized volatility for the $SPX:

That last reading? 7.41%. That's absurdly low, especially compared to where we were last quarter.
So if you think that this new volatility will become the normal volatility, the $VIX is actually still at a hefty premium. Let's compare 30-day implied volatility and 20-day historical volatility:

Implieds are still trading at a tremendous discount relative to the slow climb exhibited over the past month.
So if you want to be bullish vol, you are making the claim that realied vol will increase-- and that the market will be putting in a short term top soon. Tough call.
A Look At History
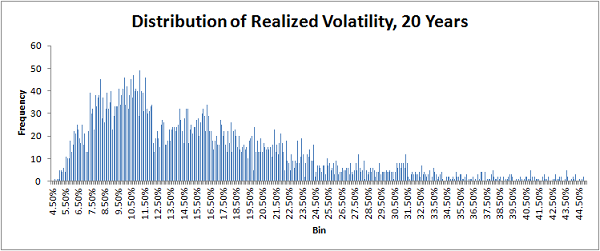
Where's vol relative to the past? Well, we can take a look at past volatility readings over the past 20 years:

Distribution of realized volatility resemembles a gamma distribution or a poisson distribution, and eyeballing it we can see that the bulk of the readings lie between about 8 and 12. So vol is on the low side, but still "normal" relative to longer term readings.
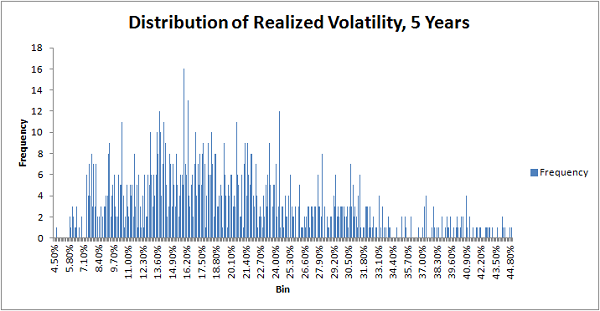
But what if we just look at the past 5 years?

This tells a different story-- the chart, although a bit more messy, shows the bulk of samples between about 11-20. So looking at recent price history we get a feel that volatility is very overdone to the downside.
If you are looking for a pop, check out 4 simple ways to hedge in this environment.
If you think we're in a new normal... well, welcome to 2006.