Jared from CondorOptions is out with a great post about how delta can change over time and how month selection, while never really discussed by many option traders, is still a very important part of managing risk in the options market. You can read the full post here, but this excerpt really stuck out:
As expiration approaches, the delta of in-the-money options approaches one, while the delta of out-of-the-money options approaches zero. Known also as “charm,” delta decay is a second-order Greek that measures the rate of change of delta per day.
And that makes sense; the closer an option gets to expiration, the more binary it becomes. And if you're buying out of the money puts as hedges, the closer they get to expiration, the less hedginess you'll get.
Color, which is gamma as it relates to time, is another consideration when it comes to option selection. Consider this chart:
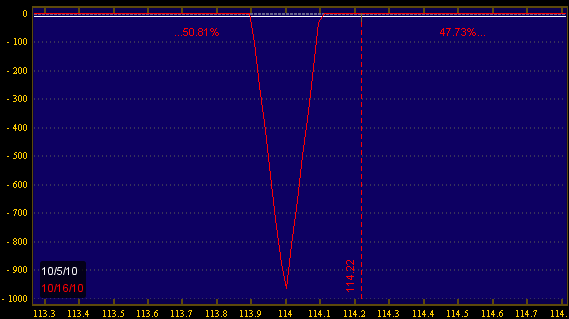
Remember that delta is the change of the position price relative to change in the underlying-- this is essentally the slope of these lines. Furthermore, we know that gamma is the change in the delta, so it's the change in the slope of these lines-- we can also look at the "curviness," or 2nd derivative. The yellow lines see less change in the "steepness" as we move around in stock price, but that changes as we approach expiration. Delta at expiration can be only 2 things: 0 or 100, depending if the option is OTM or ITM, respectively. That's what I like to call the gamma knife edge:
And we can see that reflected in this chart: the current gamma of the sold put is around -9, but when we get to opex, we have a discontinuous change between 0 and 100-- this creates what's known in engineering circles as a "dirac function"-- essentially a giant spike.
So we know that for sold options, gamma increases in magnitude over time. This is known as color. If you are selling puts with 5 weeks left, you will have less overall "heartburn" than if you sell puts with 5 days left. The tradeoff is less theta, but that's for another post.

