• Skip to primary navigation
  • Skip to main content
  • Skip to primary sidebar

Investing With Options

Become a Better Options Trader

NFLX Technical Analysis and Trade Ideas

January 22, 2009 By Steven Place

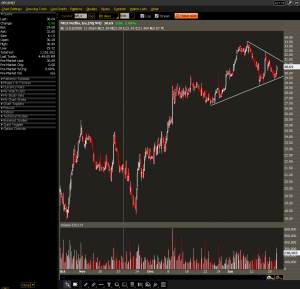
I'm seeing a pretty good ascending triangle open up short term on NFLX. This is a continuation pattern and if it breaks, it should break above that resistance at 33.

NFLX 30 Min Asc Triangle

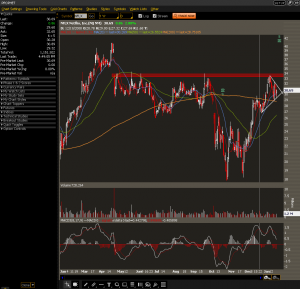
That 33 area does have some serious resistance in the long term, however:

NFLX Daily Chart

So what sort of plays can we look at? The best bet I think is to wait on the break of the upside resistance and then get into some calls at the 32.5 strike price. If we hit that 33 area I'll look at the price action and if I see weakness, I'll sell some front month calls at the same strike price. With that play you can start picking up some pretty good theta. I want to keep this as a trade and not a long-term hold as the market conditions can change at any moment.
Free Iron Condor Toolkit

Want to learn how to beat the market without needing to time the market?

Do you desire a way to earn aggressive returns without staring at screens for six hours a day?

Get this free iron condor toolkit that will show you how this trade works in the real world.

Download the Toolkit Here

Primary Sidebar

Resources


Option Trading Basics
Income Trading

Recent Posts

  • IWO Live – May 21st – The Market Refuses to Die: Why Sticky Bids, Gamma Squeezes, and Degenerate Trades Are the New Normal
  • How I Profited From A One-Day Pullback In Tech Stocks
  • 3 Option Trades for CCIV
  • Time to Call a Top in Solar
  • Winning In Both Directions

Get The Options Trading Training You Need.

See All IWO Trading Courses!

© 2023InvestingWithOptions | Disclaimer | Financial Disclaimer | Terms and Conditions | Privacy Policy