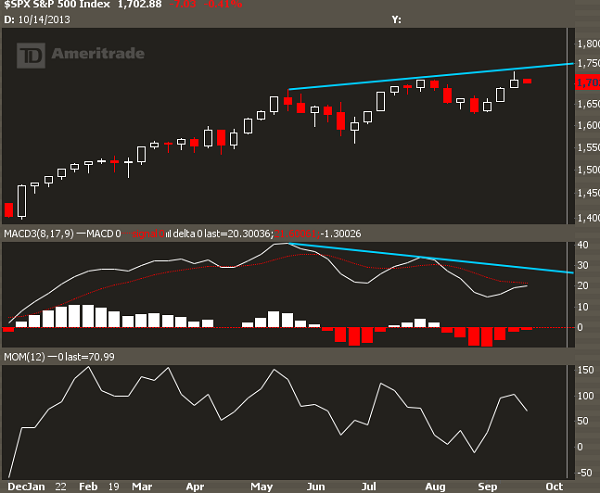
One of the most concerning charts for bulls right now is a weekly S&P with some momentum indicators.

While the market continues to push to new highs, the "oomph" behind the moves are decreasing.
The term for this kind of setup is a "divergence," where a particular indicator diverges from the trend in the stock.
So what this tells us is that the trendiness of the marekt continues to wane, meaning that the buyers stay in control but with less power and for less time.
And intuitively this makes sense. The rally we had from December to May was magical and nobody really started to care about headline risk until the summer.
So is this it? Is this the top? Probably not-- we're most likely headed for continued reversion.
And keep in mind, stock correlations are very low right now, so you can get away with playing individual names long without a ton of market risk.
Finally, this divergence is showing up on the S&P and the DJIA, but not on the Russell 2k or the Nasdaq. This is most likely due to continued rotation into tech, and the fact that components of the S&P are more sensitive to rates than tech.