Implied volatility is a concept that many new traders don't seem to understand.
In my opinion, it's a teaching error, not a concept error.
When traders try to learn about implied volatiltiy, they tend to get stuck in all the math and theory behind it-- but I think it's best taught visually.
So let's start with the basics, and build up to the overall concept.
What is Volatility
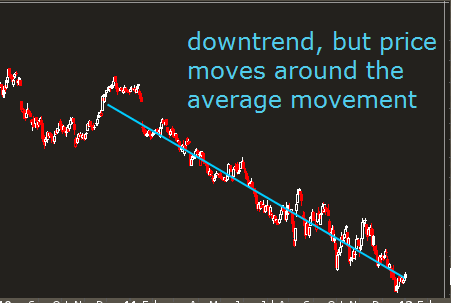
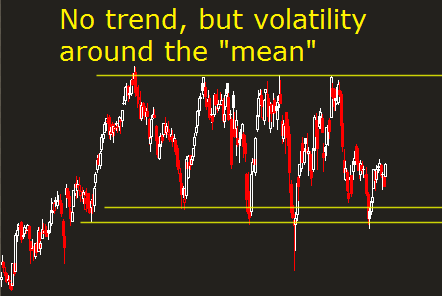
Simply put, volatility is the price movement outside of a trend.
Note that a "trend" simply refers to some sort of mean. So if a stock has been flatlining for a while, it can be considered a trend of 0.
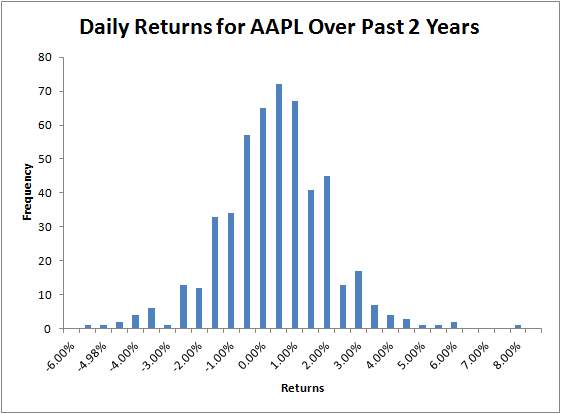
So the amount that a stock "deviates" from it's trend can be considered its volatility. This can be modeled by looking at a bell curve of daily returns. The chart below shows the volatility of AAPL when we detrend the data.
Implied Volatility vs. Historical Volatility
But looking at trends and past price action will only tell you what has happened in the past-- the historical volatility.
We want to know what could happen in the future. We do this by looking at the options market and what the option pricing is implying-- hence, implied volatility.
How to Find Implied Volatility
Volatility is risk, both to the long side and the short side. Option trading gives you a way to avoid that risk, but for a price. That price, set by the market, is where we find our implied volatility.
Here's the breakdown of an option price:
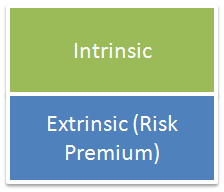 The intrinsic value is the component of option pricing that is the relationship between the strike price of the option and the price of the underlying stock. It tells you how advantageous it is to exercise the option at expiration.
The extrinsic value is the value that's left over. It is the "excess" value that is also known as the "risk premium" of the option.
We can break down the extrinsic value even further to two components:
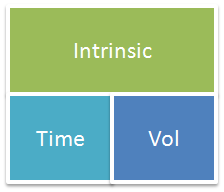 The extrinsic value has two components of risk: time risk and volatility risk. The time risk is related to how many days are left between expiration and the current date.
The volatility risk is what's known as the implied volatility.
This value tells us what the options market is expecting in terms of price movement outside of the trend.
How to Calculate Implied Volatility
Honestly, I'm not going to explain it. Unless you're takig a colleg finance final, it's not needed-- your brokerage platform does it for you automatically.
What's important is what the number represents. Right now $GOOG has an implied volatility around 33% when you average the options together. That means the market is expecting a move of +/- 33% by the next year.
Implied Volatility Video
Still confused? Check out my video below to get it explained on pen and paper:
So now the question is: how can we trade implied volatility? How do we know if it's overbought or oversold? These questions we answer every day in my options trading newsletter.
