Okay. Here we go. Stepping in front of this freight train. I'm probably early.
At the time of writing this, TSLA is trading at 750. The previous trading day it was 100 points lower. And the way it's going, the stock will tag 900 by the end of the week.
But still... there's some metrics I'm seeing that make it worth a shot to the short side.
I'll get into those metrics in a moment. First, I want to get a few disclaimers out of the way.
First, stocks and options are risky. Second, you're responsible for your own results in the market. Third, this is for educational purposes only.
And the final disclaimer... your timeframe matters.
TSLA can be a revolutionary company that completely changes how the world works.
It can also be really stinkin' overbought. Just depends on what your zoom is set at.
When you look at stocks that are trading like TSLA, you can't just rely on a single factor. Saying it's overvalued is incomplete. Saying it's overbought is incomeplete.
You gotta combine several factors into a good trading setup. Let's take a look at a few.
Does This Pass The Sniff Test?
At a price of $750 per share, that puts the value of the company around $135B.
To put that in context, let's look at a few companies with a valuation around that size:
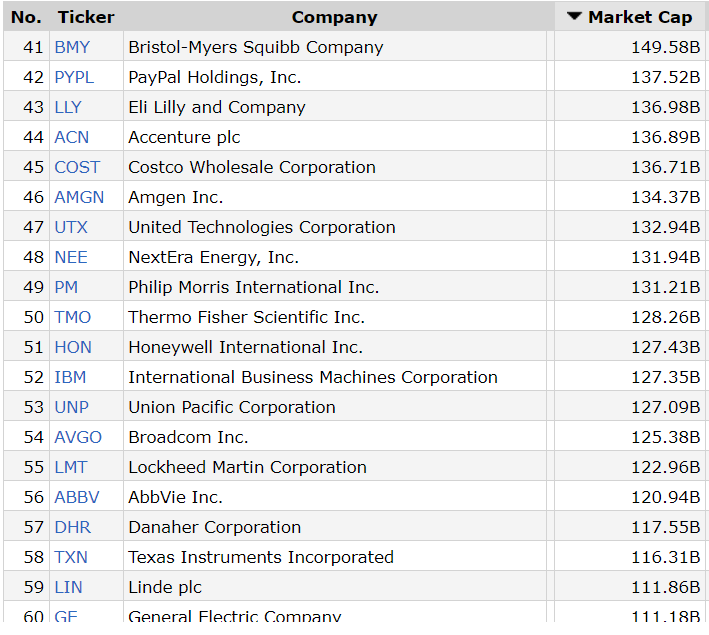
Right now, TSLA is worth more than Texas Instruments. More than Lockheed. More than IBM.
Does that really make sense here? I suppose it could. It could grow fast enough and scale to increase their margins and do all the things a good business does.
But did all of those improvements happen overnight?
Earnings was released just 3 trading days ago, and the stock was trading at 587. Has anything materially changed from their earnings, sales, and guidance numbers?
Probably not.
Now here's the warning-- saying a stock is "overvalued" is not reason enough. Investors have been saying that about TSLA for years and look how that has turned out for them.
Let's move onto some other statistics...
Tell Me Something I Don't Know
Using traditional indicators will tell you the stock is overbought.
Here's a look at the Relative Strength Index (RSI) on TSLA:
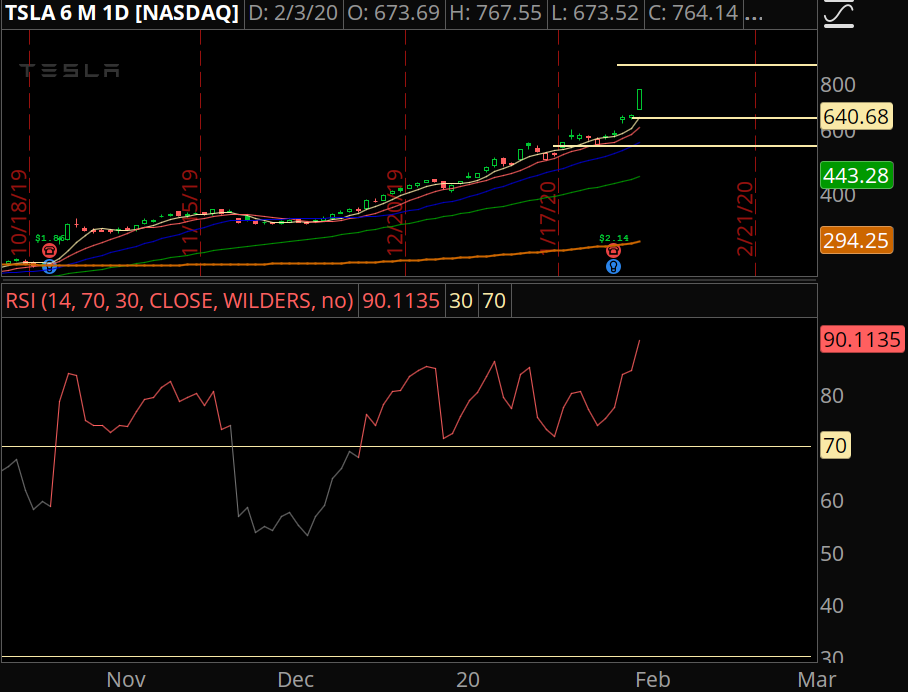
Overbought. Yup. Says so right there.
It's also been "overbought" for a full month and 300 points ago.
We gotta ask exactly how overbought is it?
This is where a new study comes in.
Measure the Stretch
One of my favorite indicators shows us the distance between the current price of the stock and a moving average.
It's called the MA Deviation indicator. Here's the indicator set to 50 days:
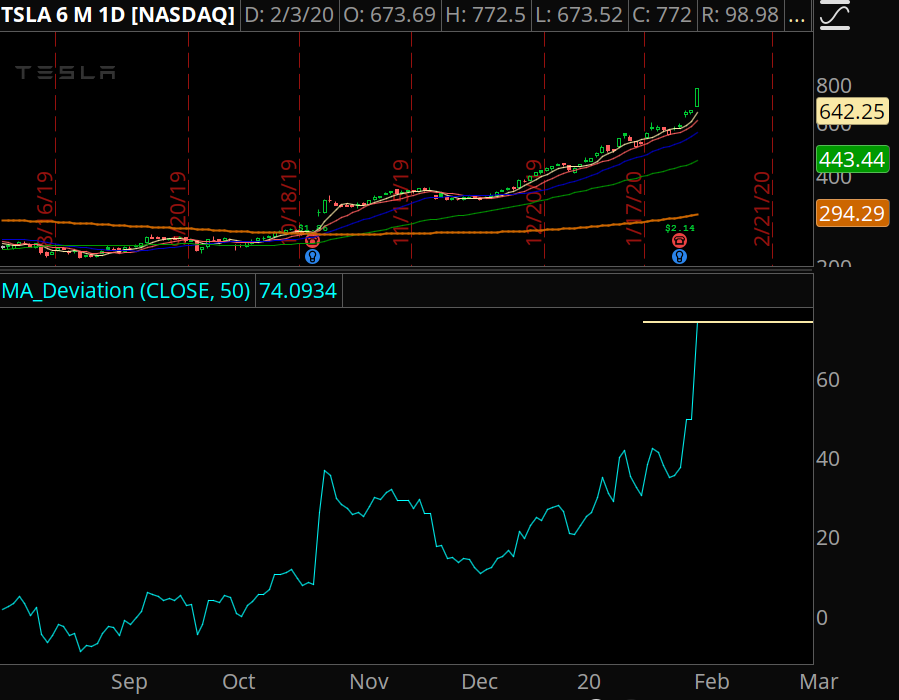
TSLA, right now, is 75% above its 50 day moving average.
That's wild. And it's the strongest reading we've seen in the stock for years.
Can it get more stretched than this? Of course. Here's how the stock traded back in 2013:
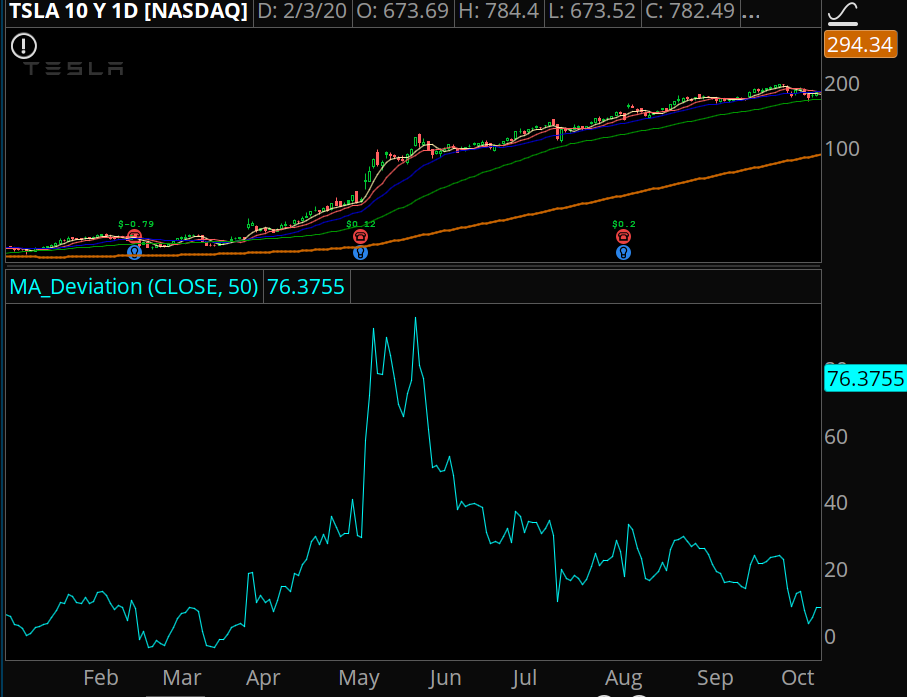
This reading peaked at 94% above the 50 day moving average. If we were to see something similar in the stock today, it would be around 860.
We can also view the distance between the current price and the 5 day moving average:
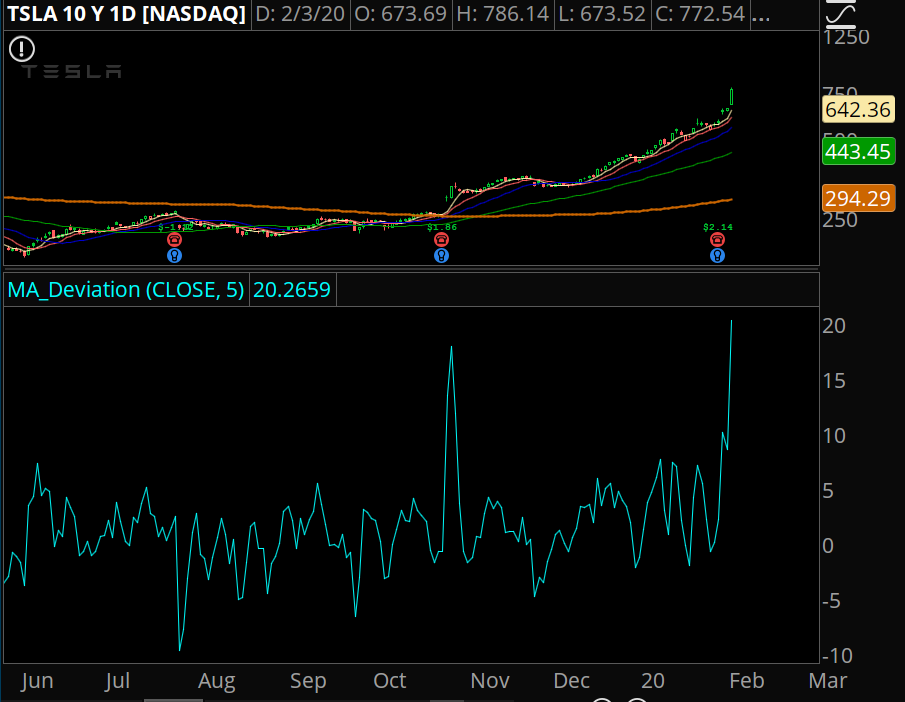
The stock is 20% above its 5 day moving average.
This is now an OTIS pattern.
("Oh, This Is Stupid.")
There's one more reading I'm looking at that leads me to call a top here.
The Options Market In TSLA Is Completely Upside Down
In MOST situations, investors are scared about a market crash. Downside risk.
That's why the option values for puts will be higher than calls. More investors want to pay up for insurance than speculate on upside.
As an example, here's the SPX curve:
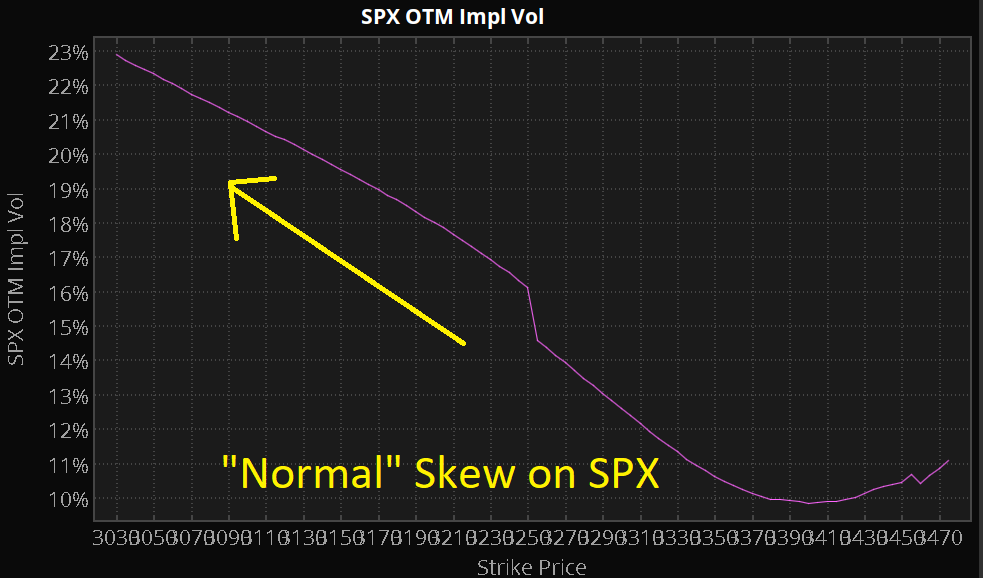
Here's the TSLA curve:
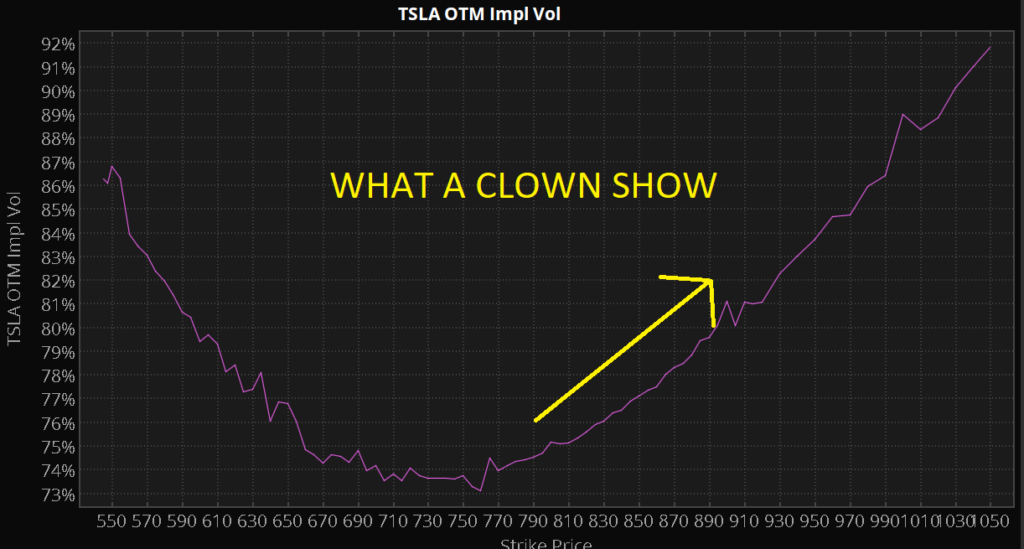
If you can't read the chart, here it is in simple terms...
Lots of people are buying calls in TSLA.
Now here's the thing... I don't think the players buying TSLA calls are betting on upside price action.
I think they're traders who thought they were smart shorting calls last week and are getting BLOWN OUT OF THE WATER.
This move in TSLA is a massive short squeeze. Not just short stock, but "short gamma" from all those traders who thought they had a layup trade because there's no way the stock could go higher, right?
Well it did, and they're getting screwed.
This is parabolic, upside capitulation. And when that capitulation ends, we'll have a proper pullback.
I think that is close. I think we're near a top. I could be completely wrong and the stock skyrockets to $1,000 and never look back.
Yet what I've seen in my experience, from other stocks that have done this EXACT THING, that we're close.
In terms of how to trade it... it's up to you. I don't think getting net short options is the best payoff because there's always the possibility of getting runover.
Do you want to see the exact options trade I took?
Do you want to see a full video rundown of how the trade works?
That's what we do at IncomeLab every day. You'll receive trade alerts that have a full video breakdown of the trade.
Start your 30 day trial now to get instant access to the TSLA trade setup.