Disclosure: Me writing about the absurdly low volatility may be a contrarian signal and mark the bottom (in terms of vol) for a while. I would gladly welcome this, and am positioned to do so.
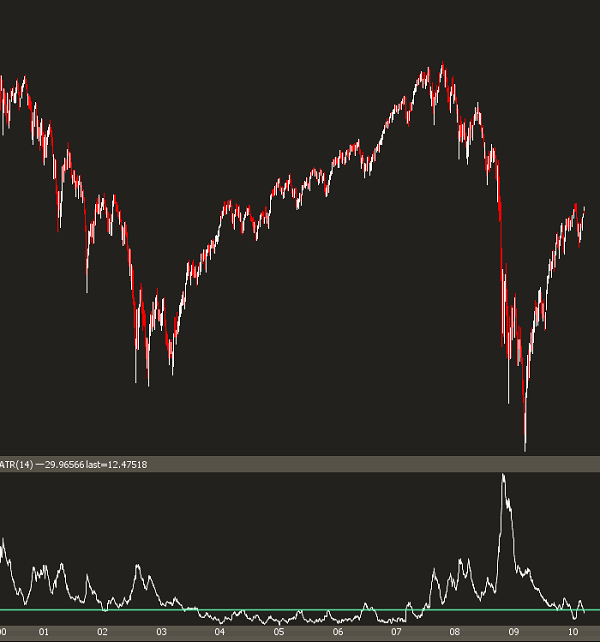
I want to show a chart. This is a 10 year daily chart of the SPX with the bottom pane showing the average true range for a 14-day window. That study is a measure of volatiltiy.
I've shown this chart before, but given the current market environment, it warrants another look.
The main point to derive from this study is that this is not the 2008 -2009 market. Both markets were extraordinary in terms of volatility, and it is the exception, not the rule. Trading strategies that worked a year ago may not necessarily work if we get back into an environment similar to 2004-2007. A little more fading, mean reversion; a little less stock correlation and market breakouts.
The question here is: are the strategies you're currently implementing in the market going to work if the market vol dies? It's something worth analyzing going into the summer months.
