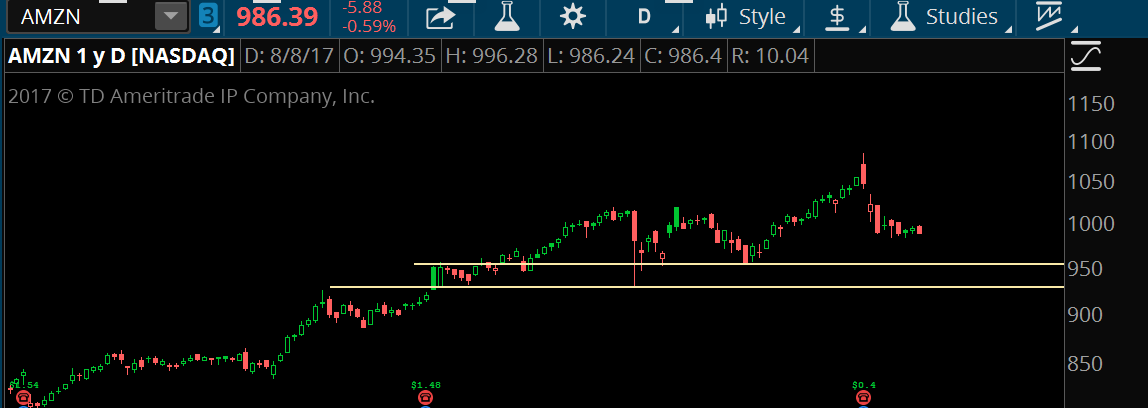
Just recently, Amazon reported earnings and the stock faded hard.
The next day, the stock gapped down, and since then it has failed to find enough buyers for any kind of decent bounce.
The long term trend is still intact... yet it's possible to see a little more downside action.
Question is-- where should we expect the stock to find stronger buying support?
Step 1: Key Price Levels

Ever since AMZN had a mini-flash-crash in June, I've been keeping my eye on that day's low to act as a key support level. Combine that with a few other price supports and we have a clear area around $950 where we should expect buyers to step in.
Step 2: Moving Averages

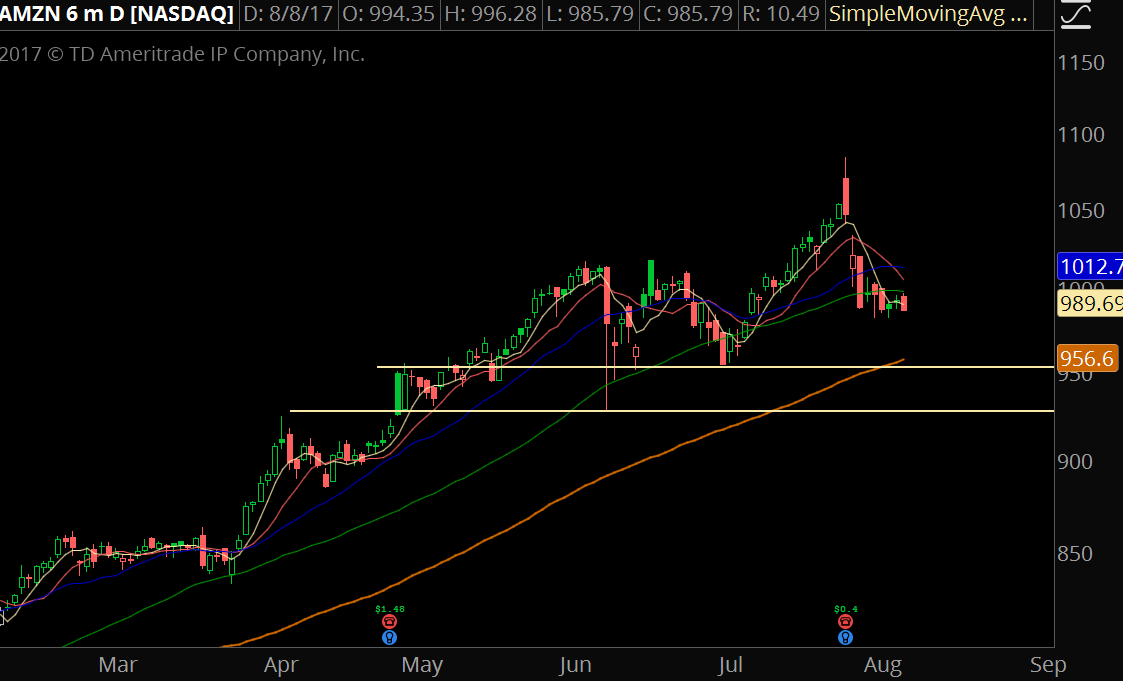
The current price is below all short term moving averages, which shows us that sustained selling pressure in on the stock from traders.
The next long term moving average is currently at 956... the 100-day moving average. We've got more evidence that the 950 area will be a high-odds level where buyers step in.
Step 3: Turning Point Indicator

The Turning Point Indicator is a powerful tool to give you probabilities of future price movement. It allows you to be proactive with your trades, instead of using indicators taht only look in the past.
Click Here to Get Free Access to the Turning Point Indicator
The 10-day TPI shows a move of -5%, which is already oversold on a short term basis. The fact that there was no aggressive bounce once we came into that -5% level tells us that longer term market participants are involved in the stock and we'll have to use a different timeframe.
The 20-day TPI puts a key level at -6%. In fact, it's very rare for the stock to selloff more than 8% in a 20 day timeframe... but this is also because the stock has been in a solid uptrend.
Do some quick math. The gap down open from July 28th sits right at 1014. If we were to have another 6% drop off that level, that gives us a downside target of $953.16, which is right at the beginning of the support range we've pointed out already.
How To Trade This
With options trading, it's not just about where you think the stock is headed... it's where you think it isn't.
We know that key support starts at 950, and we also know that to see a move to that level would be statistically stretched to say the least.
A good trading strategy would be to start scaling into put credit spreads if the stock manages to find fresh sellers and it breaks down below its near term range. Of course it's possible that a new catalyst brings in more sellers and the stock tanks... but we're dealing with the odds, and the odds are good to start placing bullish bets onto a second leg lower.