Over the past few days I’ve been talking about the live class that I’m doing this weekend.
I’d like to pull back the curtain a bit more and show you what I’ve been working on.
When you deal with options, profit comes not just through price but also through time.
That means backtesting looks a little different when you’re trying to find a winning strategy.
When you’re taking an investing approach, you want to find a way to own stocks at the best prices possible, without missing on too much upside.
That’s where this phrase comes to mind:
“Simple, but not easy.”
I’ve been hard at work developing models that give investors the results they desire without having to second guess themselves.
Here’s what I mean…
This is a chart that shows the 10 week returns distribution on a well known stock:
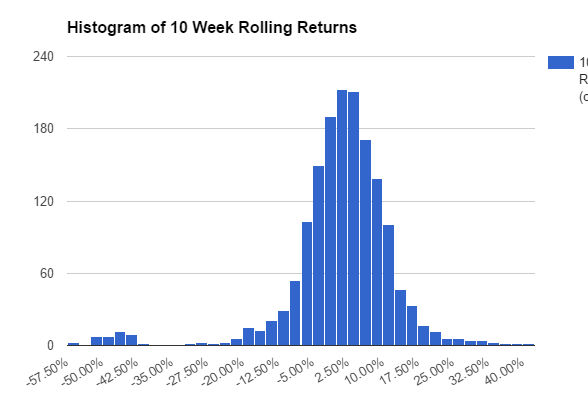
And here are the distributions when I look for a very specific signal.
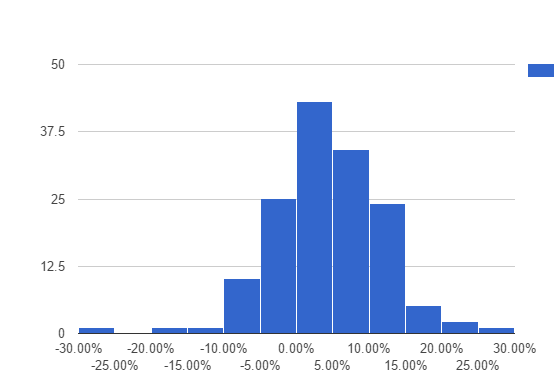
See the difference?
The downside on the second chart has a lower frequency. This is where it makes sense to get bullish.
That’s where your edge is as an investor.
How about these two charts:
The first is from the S&P 500 when a certain signal triggers:
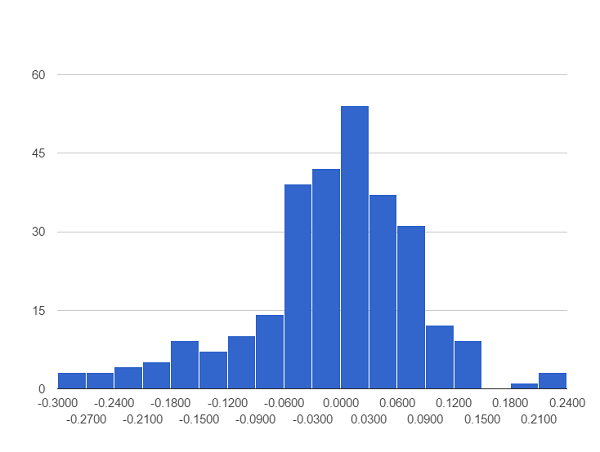
Pretty ugly, right?
That’s a lot of downside action.
However…
Here is what the returns on the S&P 500 look like when that signal reverses:
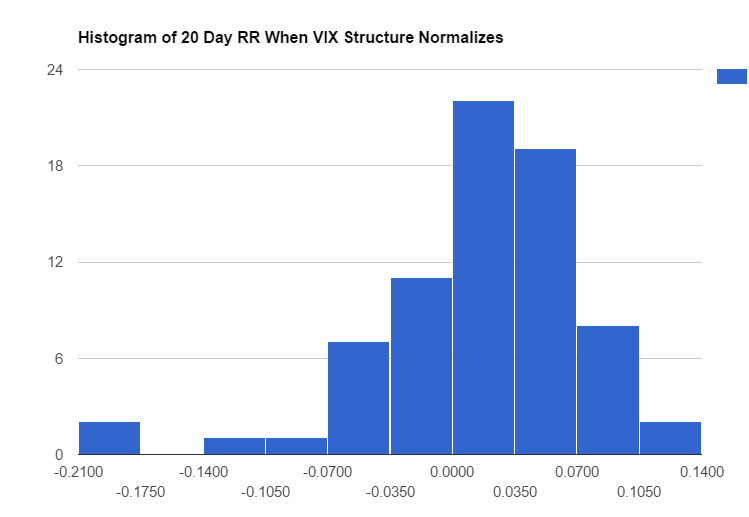
The lesson here is to use the signal not as an obvious buy point, but instead to slowly scale in because once that signal flips, the downside is done.
Here’s where it gets fun…
If you can combine backtesting with key option strategies, you’ve got a formula for massive success in your investing career.
Pretty cool, right?
If you want to get the training and the backtests this Saturday, all you need to do is sign up using the button below.
I look forward to seeing you at the training!