While the S&P has seen a strong breakout from its summer range, the XLF has clearly underperformed the rest of the market. There is a distinct level of resistance at 15 that has yet to break. Under the surface, things are looking weak, with names such as AXP and BK appear as though they are on the verge of a downtrend. It really will come down to earnings as to whether the financials will pick up-- if they do, the S&P will hit 52 week highs before Thanksgiving.
JPM has the highest weighting in the XLF (12.4%) and it is also the first to report. So if we can get a good read on JPM, the financials may follow suit in this highly correlated market.
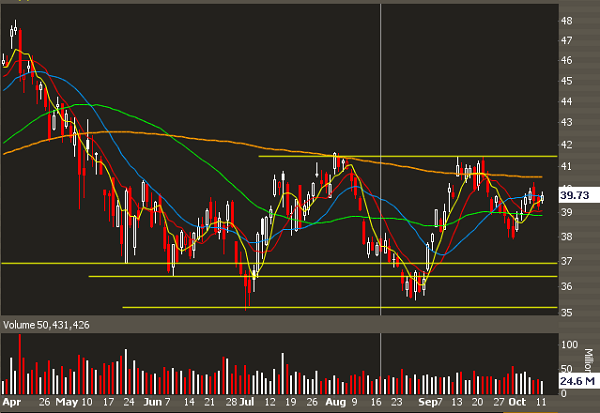
A quick look at the chart and we can see how XLF and JPM are tracking one another fairly well. There's clear resistance at 41.50 and clear support at 38. The clearance above that resistance would most likely get XLF above 15 and trigger the rest of the market to follow.
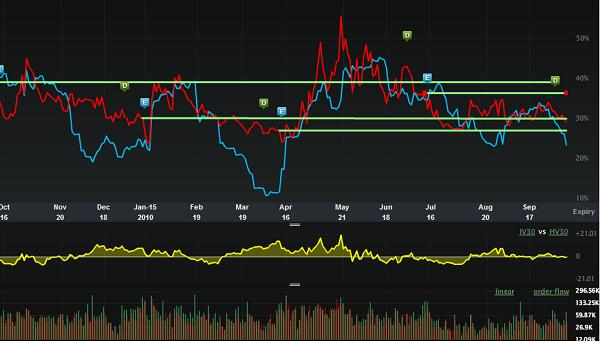
The current 30 day implied volatility (red line) is near the low end of the range, so it's safe to assume that JPM doesn't have an FDA trial coming up... the lower vol makes sense as option buyers are tiring of this range and there's clear technical boundaries to potentailly limit any gap.
Looking at the current ATM straddle, we can see that the market is pricing in about a 1.50 move in magnitude. The average gap over the past 4 earnings events is .93, so there's potential for a vol sale here.
Also, there has been some decent options activity. On October 1st about 17,000 Jan 39/42 call spreads were bought-- assuming this is an opening order, that is a fairly bullish bet. Similar trades on different strikes were made that day as well. Nothing on the options tape that I can see is screaming bullish or bearish, just moderate bullishness with a hint of vol selling.
IWO Members will be getting a fresh, actionable trade setup to trade this earnings today. If you want to see how we trade it, sign up here.
Also, if you want to learn how to trade options profitably, check out my video course at EarningsTrades.com

