Markets are in an absolute "melt-up" mode.
Here's a few reasons why:
- Absence of news. The Fed hikes are pretty well projected, and all the central bank policies are "known knowns." There's no major elections up on deck, and overall economic data hasn't been too surprising.
- Sideline money. Institutional investors are being forced to rotate money into stocks.
- No reason to sell. Over the past few months, there have been a handful of shakeouts, but sellers never showed up. Lack of sellers means price has to auction higher to entice new sellers to come in.
We can analyze the "why's" to death but that won't get you actionable trading analysis. Let's start with a daily chart of the Russell 2000 index.
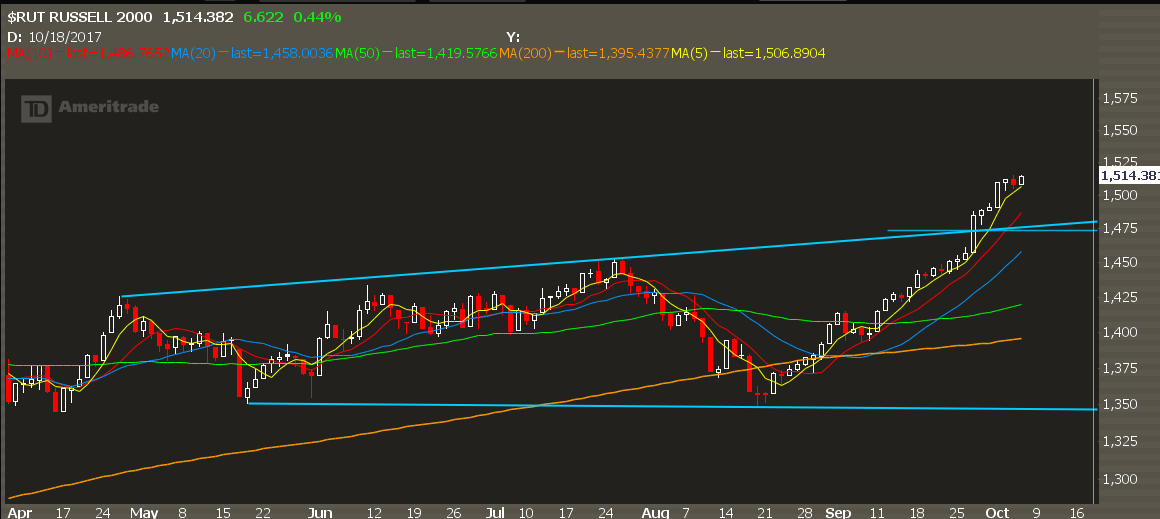
The pivot low of 1350 was put in in the middle of August. Since then, small cap stocks are up 12%.
That may seem like a lot... but small cap stocks tend to be more volatile, both to the upside and downside. Here's a look at the IWO Turning Point Indicator over a 1 month period:
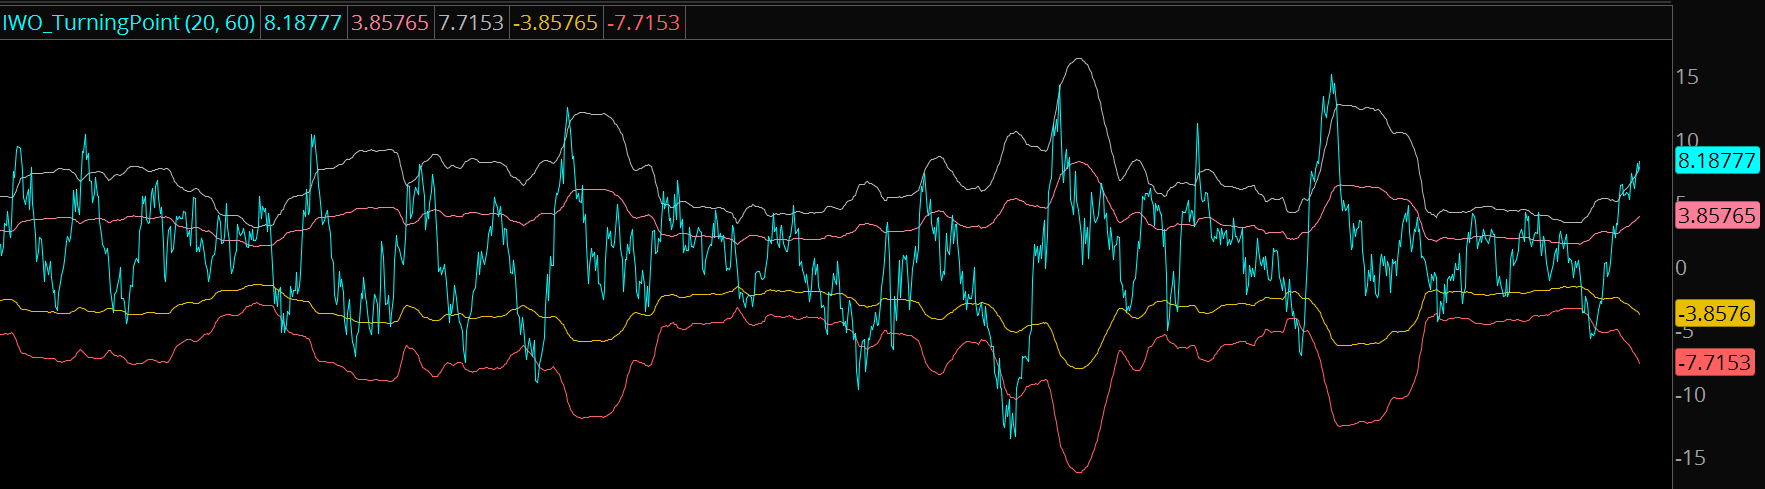
Sure, the index is up 8% in a month, but we've seen stronger moves before.
What's most interesting about this current rally is how there has been no pause or pullback... at all.
Enter this "Trendiness" Indicator
The ADX is a technical indicator that shows how strong the trend is for a stock or market. It's a great indicator because it ignores which way the trend is going... we're just looking at strength.
Here's a chart of the 14 period ADX for the RUT:
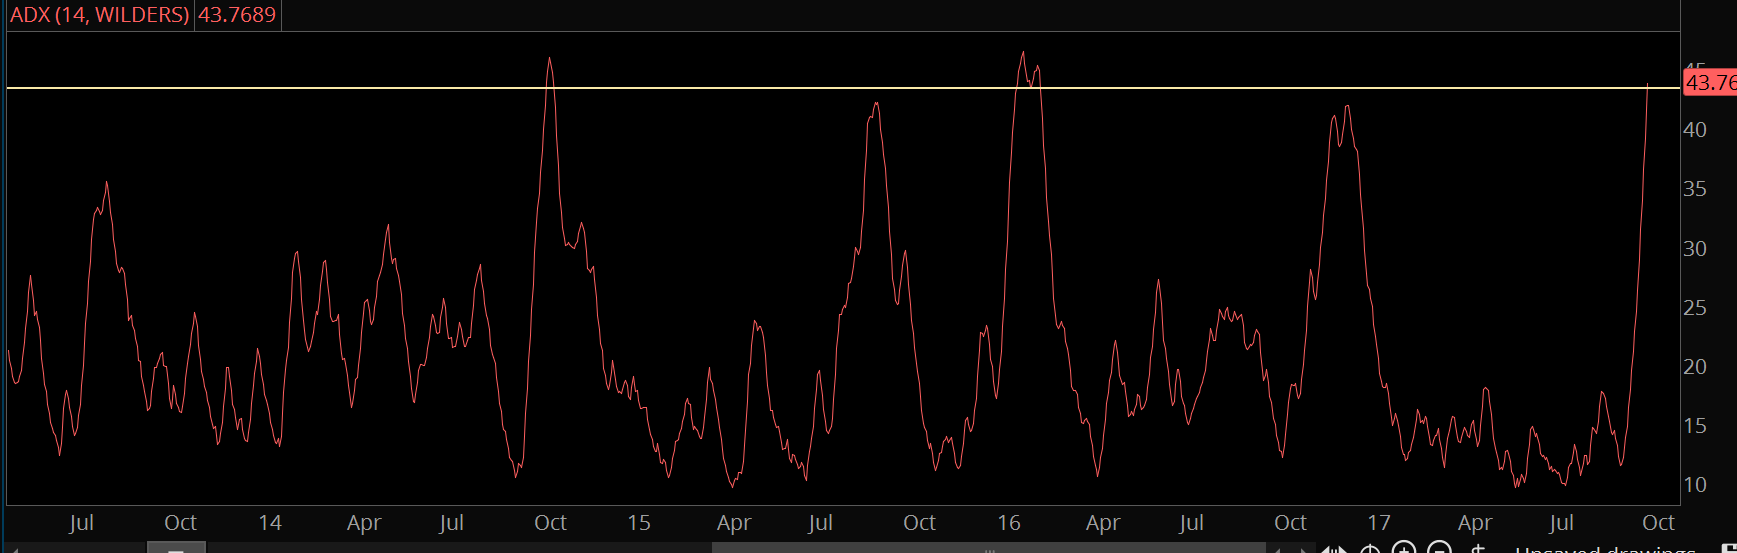
It has a reading over 40. Over the past decade, there have been 10 readings that indicate an incredibly strong trend.
Only 3 of them have been market rallies.
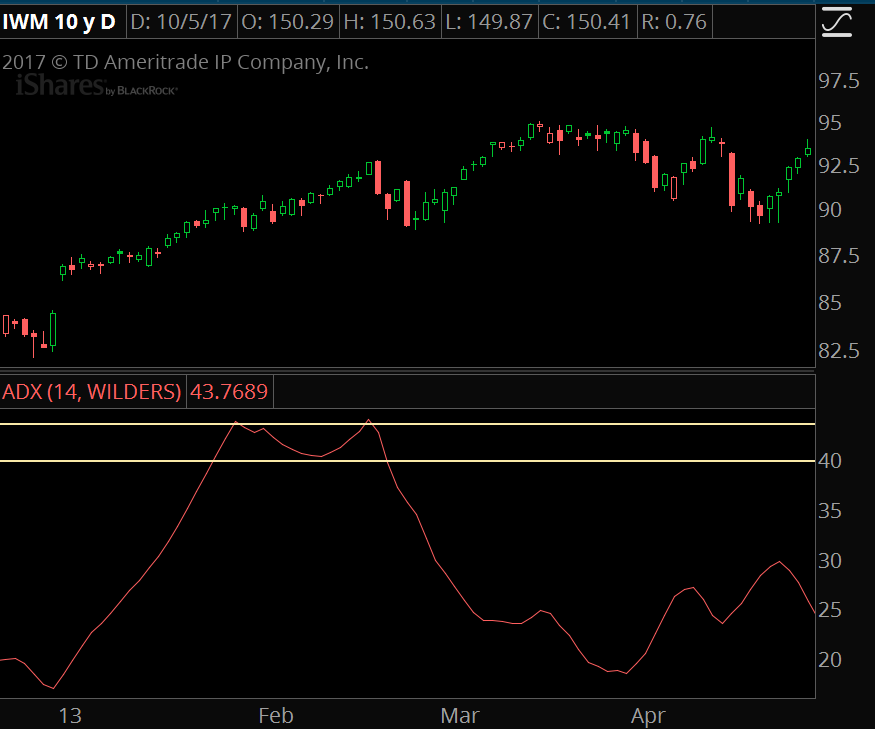
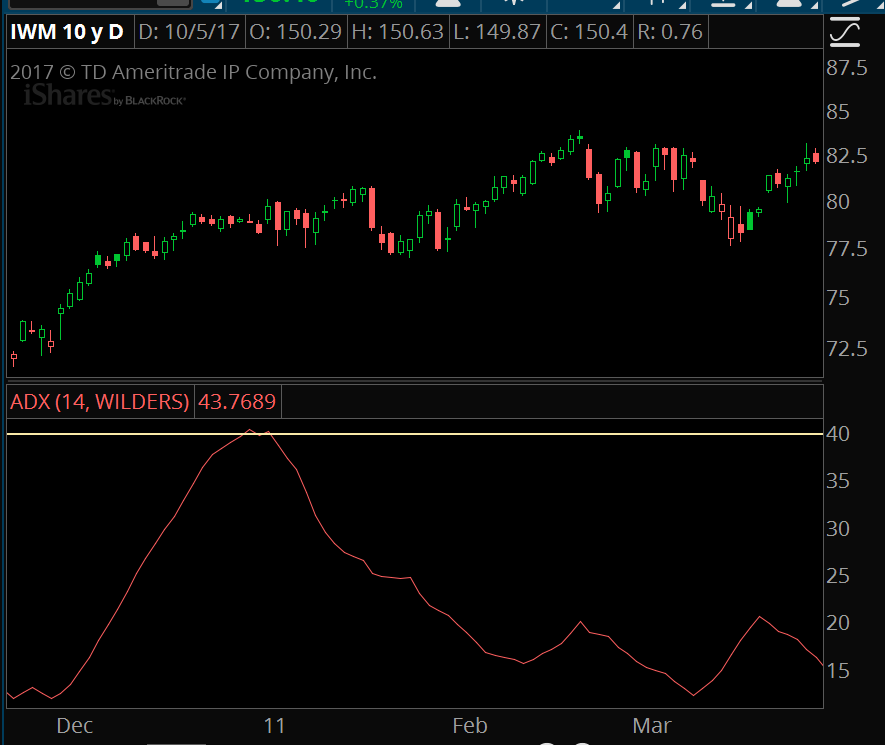
Here's how price action looked after each of the strong trending rallies... we'll use IWM as it's the exchange traded fund for the Russell 2000 index.
Nov-Dec 2016
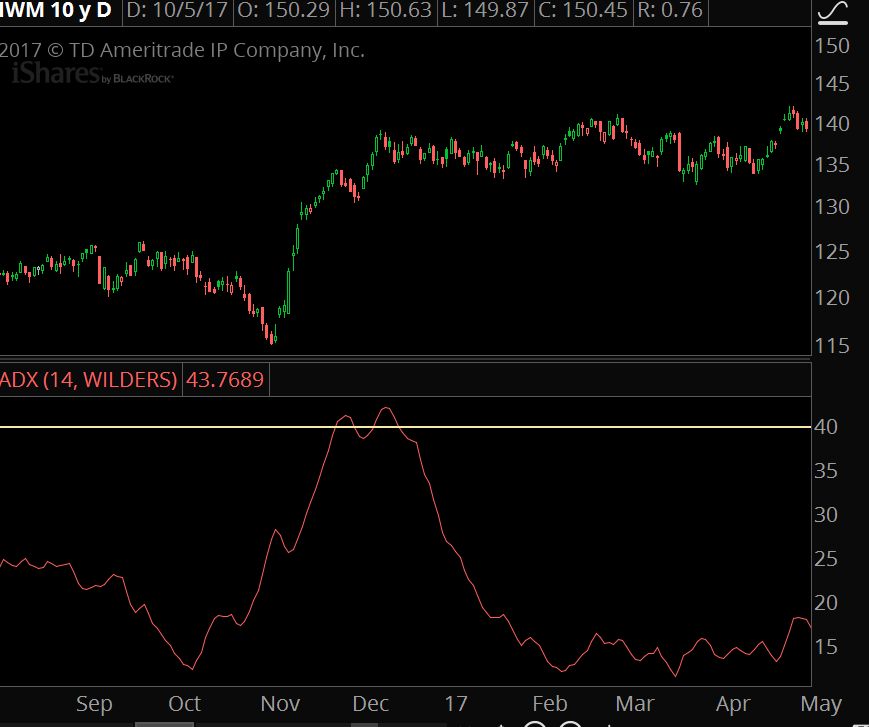
Feb-Apr 2013
Dec 2011 - Mar 2012
Are you starting to see a pattern?
Calling A Top In Trendiness
There are three market cycles I follow: price, trendiness, and option premium.
You can still be bullish on a market, but not expect the trendiness of the market to continue. That's what has happened over the past few instances-- RUT didn't exactly "top out," but it saw a market correction over price instead of time.
This is important to understand, for two reasons.
First, you've got a lot of pundits out there who are saying something like this:
There's no reason to be bearish because we're hitting all time highs. The trend is your friend.
These analysts tend to focus only on the direction, not just the strength of the trend. A little nuance here goes a long way. The market can still go higher but if you're expecting the same rate of change as we've seen over the past month, you may not be playing the trade right.
The second reason is that the option strategies you choose should take trend strength into account.
If the RUT has rallied 12% off its pivot lows without a pullback, you can still be bullish... it just may be a better trade to sell put spreads instead of buying calls.
So yes, you can call a market top... in the strength of the trend. And you can shift your option trading strategies to ones that profit more from reversion rather than a melt-up.