 Waiting to Exhale
I was running through components of the $QQQ tonight, looking for setups and getting an overall feel for the market.
Something didn't seem right. The Nasdaq had just broke out to all time highs, but many of the charts were trendless and nowhere near the kind of strength you want to see.
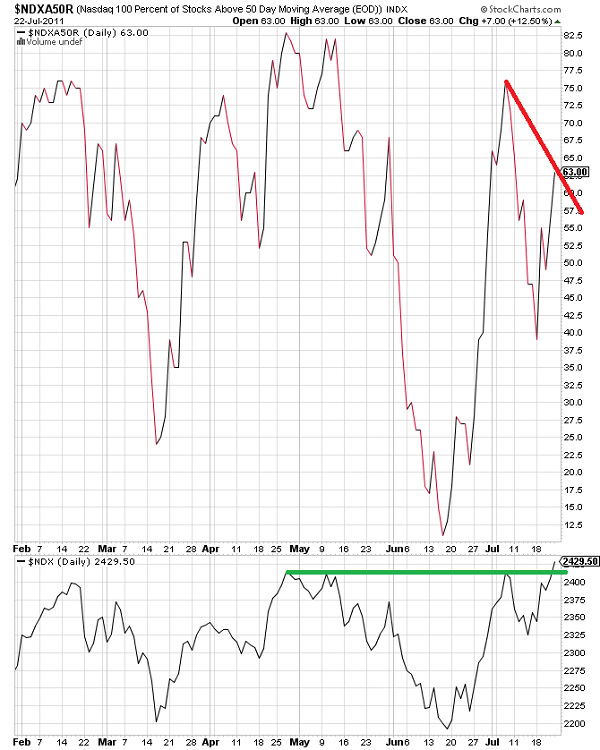
So I pulled up my trusty stockcharts.com and plotted NDXA50R. This chart shows you the percent of stocks in the $QQQ that are currently above their 50-day moving average. In essence, it's a breadth indicator.
This is not only a lower low on a relative basis, we're not even close to the levels we saw in early July.
What does this mean? This is a breadth divergence. The market is running higher on the back of fewer and fewer names. This is most likely due to the fact that we're in earnings season, and names like $AAPL, $MSFT, and $WYNN have just reported, skewing the markets a bit.
Is this bearish? So far, it is. But remember, it's earnings season. This week should give us a better clue as to whether the market is primed for a sustained move higher, or whether lackluster eps numbers from the likes of $AMZN and others will weigh the markets down.
Either way, keep an eye on this as you do want to see a broad based rally if we are to move from a mean reverting phase to a trending one.
