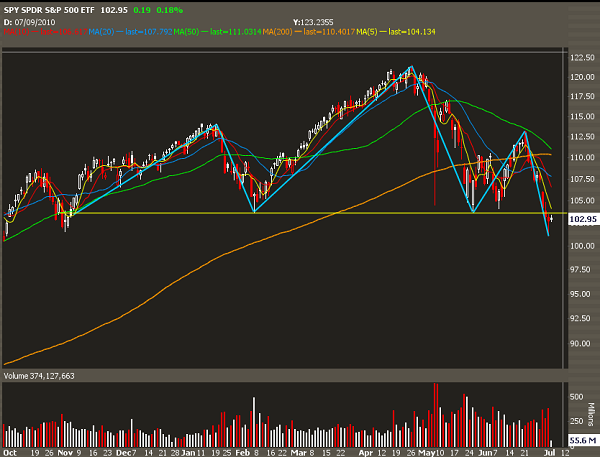
One of the problems with purely subjective technical analysis is that it falls victim to all sorts of biases. Hindsight, confirmation and others can skew our perception of what actual market action tells us. And this is normal-- odds are if you're staring at charts looking for signal, you've got skin in the game, and you're looking to speculate on market direction for profit.
Also, the signal is never pure-- there are always observer effects. In a nutshell, that means a particular level or pattern or fibonacci retracement can become a "self-fufilling prophecy" if enough observers are acting on the signal. This exists in financial markets and can be measured by, well, subjective TA.
On this particular pattern, let's look at some actual numbers by people who actually tried to quantify the head and shoulders pattern to see if there was any discernible edge in the signal.
On one hand, you've got Bulkowski's pattern research site, which claims that the head and shoulders top is one of the more powerful patterns out there. You can see the research here. A high success rate, along with a high probability of a pullback to the breakdown level, are some of the stats that are highlighted.
Also in basic TA, you have the measured move off the chart pattern. The basic idea goes that you take the price difference between the high and the low of the pattern, and you get the expected target on the H&S. The target of the current H&S is about 86.
Bulkowski also notes that the odds of actually reaching this technical price target are around half, so the odds of this target getting hit are not exactly stellar-- and I feel for this particular pattern, the odds are less as there are big levels of technical support from last year that should hold.
But there are other studies out there with different stats on the H&S. Carol Osler has done some great work objectifying the H&S patterns across various asset classes to determine whether it actually has predictive power. For example, when it comes to exchange rates, the H&S pattern shows great signal (pdf here).
But what about equities? In another paper, Ms Osler finds these results:
The identification of head-and-shoulders traders as noise traders is based on two empirical results. First, I show that the activity of head-and-shoulders traders substantially increases aggregate trading volume. In fact, the total trading generated by a given head-and-shoulders pattern amounts to one quarter of a days’ trading volume. This is important, because a trading strategy cannot serve as noise trading unless people actively use it. Second, I show that head and shoulders trading is not profitable. Like all of the major results of this paper, these are supported by numerous sensitivity analyses.
Of course even an objective study, when looking at historical patterns, can be subject to other biases, and the results could be drastically different depending on the execution strategy employed.
For this particular pattern, I'm leaning towards proper resolution of the pattern, but it will be messy due to other technical readings. Looking for a 2008 move, in my opinion, is misguided.
