I guess it's time to throw my hat into the ring.
I've tried my very, very best to keep to the trend, but we're now seeing many, many signs in this market that lead me to believe that a near term top will come about within the next week.
The market is undergoing a parabolic rise... a blow off top with price action we haven't seen in over 20 years.
I'll be focusing on the S&P 500, but the same premise exists for the Nasdaq and the DJIA... but it does NOT for the Russell 2000 index.
We're due for a drop. Here's my 7 reasons why it is just around the corner.
1. Stretched Above the Weekly Bollinger Bands
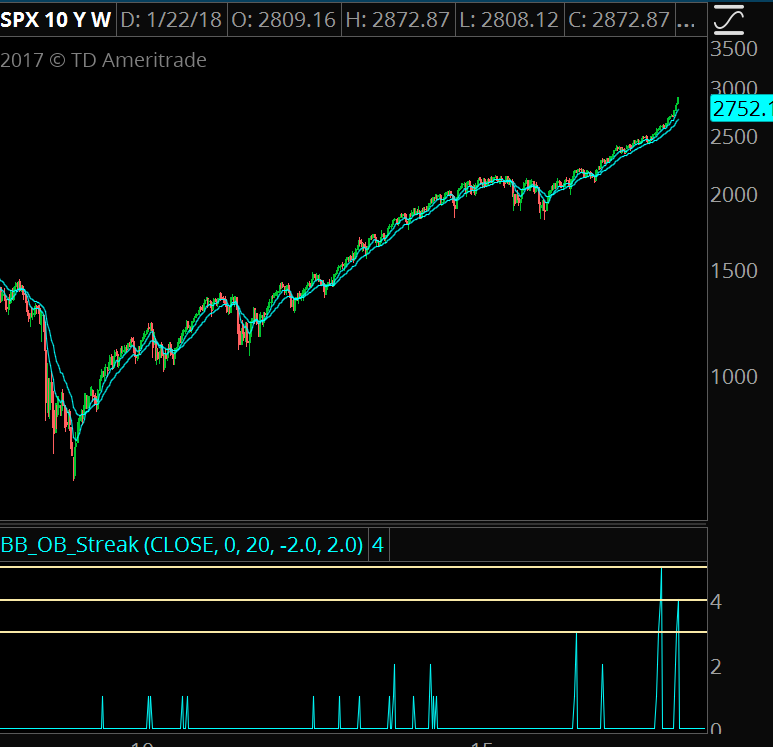
The S&P 500 now has 4 consecutive weeks above its upper Bollinger Bands. Normally I would say "wow that's crazy it hasn't happened in forever!"
Except for the fact that it did happen. Recently. Like about a month ago... where we had 5 weeks in a row above the upper BB.
The time before that?
1998.
2. Weekly RSI Is Hilariously High
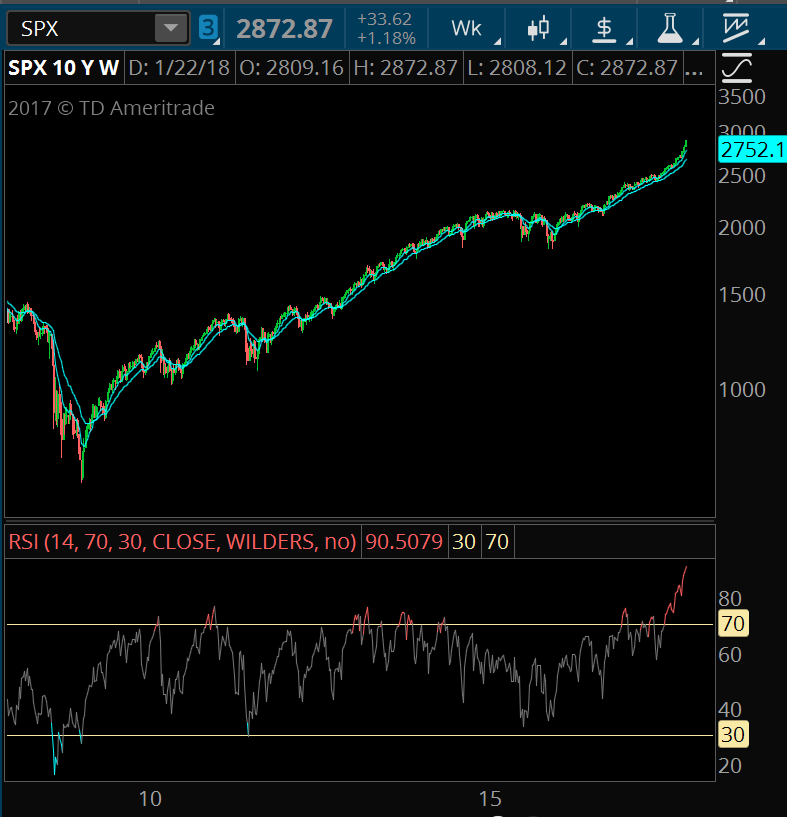
The current weekly RSI is sitting at 90.50.
Every time I look at this chart, my eyes narrow and my head cocks to the side a bit.
I think "really?"
To put some context on it, the RSI is bounded between 0 and 100.
70 and 30 tend to denote statistically stretched areas.
On individual stocks, a reading of 90 doesn't happen often... normally it's follows a catalyst like earnings or an FDA event.
To see it on a broad market index, well...
Ever. In the history of the S&P.
It hasn't happened.
The the last time the weekly RSI was this high was back during the bull run in the early 90's, but the current reading massively eclipses this one.
3. Weekly 10 Day Returns Largest in Current Cyclical Bull Market
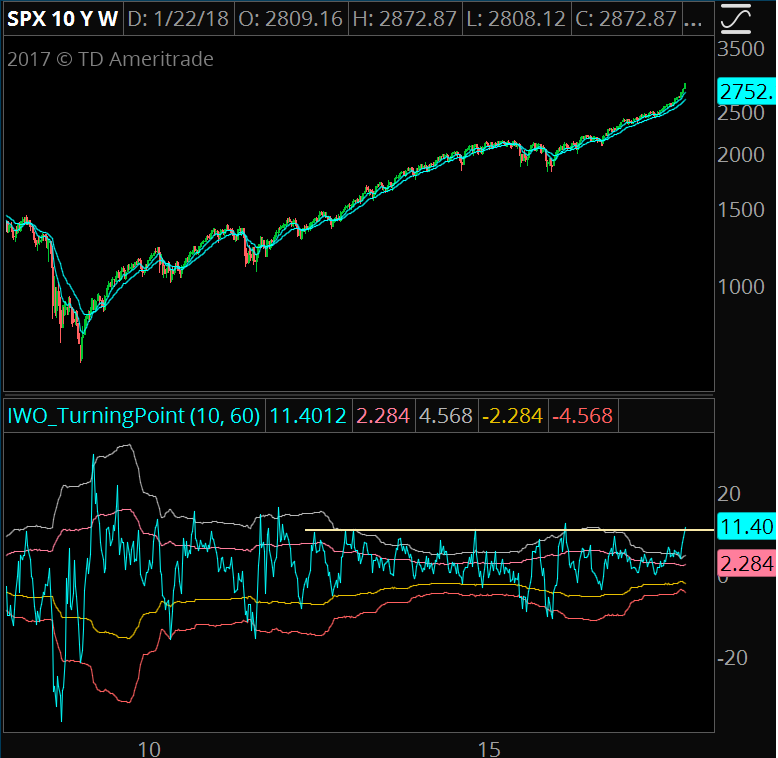
This chart shows the 10 week returns for the S&P 500, which currently sit just above 11%.
Now there have been other times we've seen this reading higher, but they generally come after a market pullback. To have an extension of this magnitude as we run into all time highs tells us that the market is currently parabolic.
4. The VIX Is Running Higher During This Move
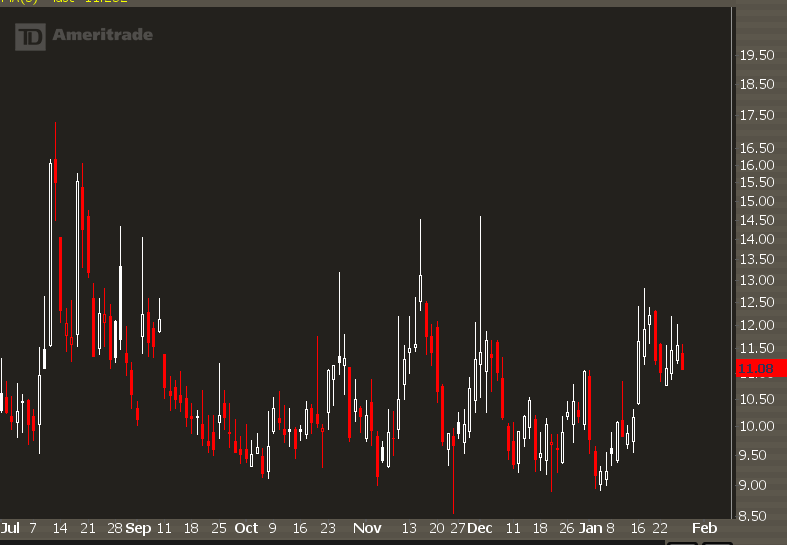
You would think that with the market rallying to all time highs, the VIX would be back to its floor of 9.
Yet the VIX spiked earlier this month and is currently holding those levels.
This is not what you think!
Many people will tell you that this is "smart money" that's hedging into a market rally, but I think it's different.
I think the VIX is jammed higher because traders are being forced to buy calls to cover short volatility positions.
If you have to buy calls to hedge, the market makers end up with short calls, and they have to buy the market to get neutral.
Fuel to the flame.
5. I Had Korean Food For Lunch On Friday
Back when we used to have selloffs, I had a trick to make the market bounce.
I would go eat super greasy Chinese food, and then the market would bounce hard.
I'm not kidding it has worked about 90% of the time.
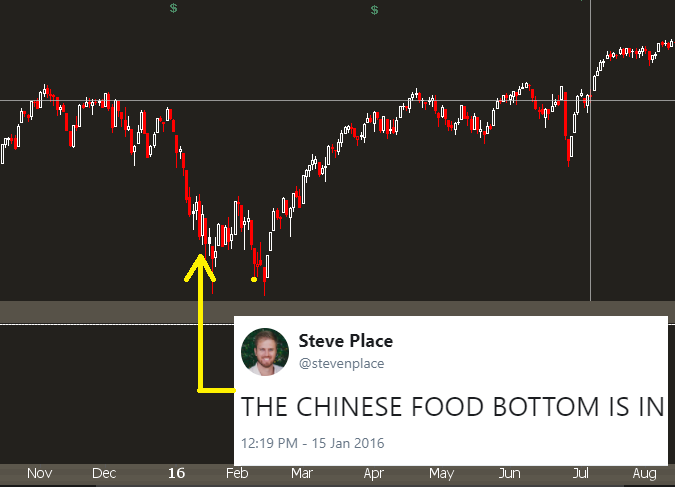
The Market Gods love my gastrointestinal sacrifice.
On Friday, I tried something different.
Because I knew that eating Chinese food would only work for market bottoms, I had Korean food for the market top.

Some lovely beef bulgogi with all the sides. It was delicious.
Odds are you're really confused right now, and that's OK. The Korean food top is an untested strategy so it may or may not work, so we'll see.
6. Earnings Are Getting Priced In
Take a look at Caterpillar (CAT):
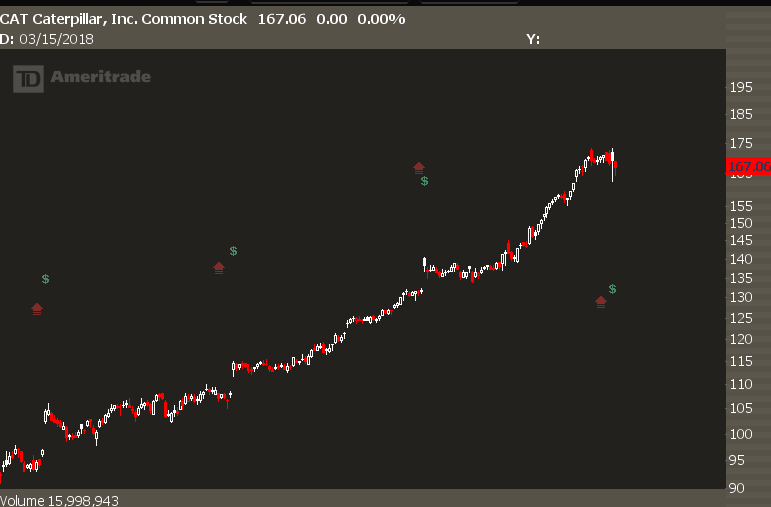
Last quarter the stock was trading at 140. It then gets jammed higher up to 170... a nice 20% rally over the course of a month and a half.
Then earnings come out and there numbers are HUGE.
But the stock didn't rally after... because the earnings move got priced in.
I'm expecting that to happen on a lot of the large companies that have been driving this market higher. Yes, we're seeing global growth. And yes, the tax reform will help out.
But the numbers are getting baked into the market already.
We're seeing this on an economic scale as well. Here's the headline from today's NYT:

Once the good news is obvious to everyone, the market has already moved enough to price it in.
7. We've Gone the Longest Without A 5% Drop
In the history of ever.
I think that streak remains the same for a 3% and 10% drop as well.
Now to put some context on this...
A 5% drop from these highs takes us to 2728... basically the month's open.
Honestly, that's a pretty hard sell. That will take some time, so I don't think that we'll see a move under that overnight.
The Real Question... Is The Market Going to Crash?
Probably not.
This market call is more about the trendiness of the market.
Namely, the lack of mean reversion that we've experienced over the past 3 months.
To me, there's basically a binary outlook here.
Either you think that this is the "new normal" and the rate of change can continue for, let's say, the next few months.
If we still have the same rate of change, the S&P will reach 3,000 by February 20th.
And 3,500 by the end of April.
This makes sense.
The second choice is to say... you know what, the statistical odds currently favor the "trendiness" of the market to cool off.
So let's put some nuance on this.
When you see a momentum impulse like we've seen it rarely markets the Capital-T Top. Odds are will will trade higher from these levels.
But markets go up AND down, not up OR down.
As earnings and economic data gets priced in, look for pullbacks and reversion.
So What Should You Do???
It depends.
If you're a passive investor, you should sit on your freaking hands. Maybe rebalance once a quarter. Don't get cute.
If you're a swing trader sitting on large gains on individual stocks, consider converting them to call buys. You still have the upside, you'll take 80% of your cash off the table, and you'll be ready to deploy that capital if we do manage to see a proper selloff.
If you're an options trader... look at slightly bearish put calendars and butterflies. They don't have a ton of directional exposure but really benefit into reversion.
Also, stock selection is still a good form of risk management. The rotational nature of this market allows you to easily trade individual stocks at better risk reward compared to broad markets.
Here's Why I'll Be Wrong
In basic physics you learn about a few things.
A weight on a spring. Projectiles. Orbits.
All of this is called "classical mechanics."
We can take a set of forces, a set of masses, and pretty easily predict what's going to happen next.
Yet if you take a mass and have it approach the speed of light, things get really freaking weird.
Classical mechanics fail.
It's possible that the current market structure is coming into an area where traditional pricing and statistics don't work very well.
Markets stretch further and faster than what statistical models suggest. The grand theory of reversion breaks.
So I could be wrong on this call. And I could be early... hilariously early.
Make sure your position sizing, risk management, and strategy selection make sense.