 Perception and Bias
Discretionary technical analysis often gets a bad rap. It goes back to ways we can know things, and whether humans can distinguish actionable patterns in the market or whether we are searching for signal in what is a bunch of random-walk noise.
If you've read any of my posts, odds are you know what school of thought I am in. But technical analysis requires a lot of nuance, recogizing that sometimes there's just some voodoo and that nothing is in black and white.
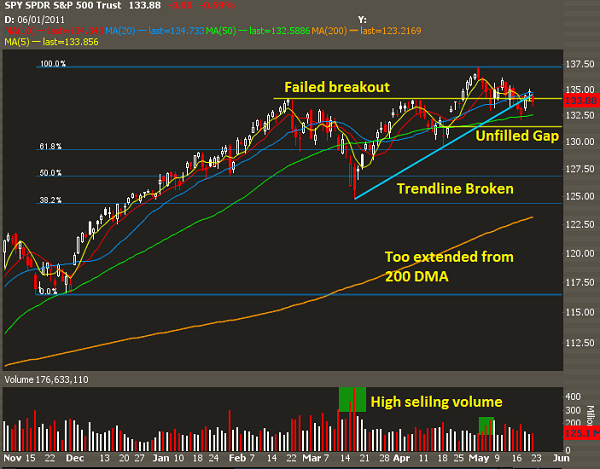
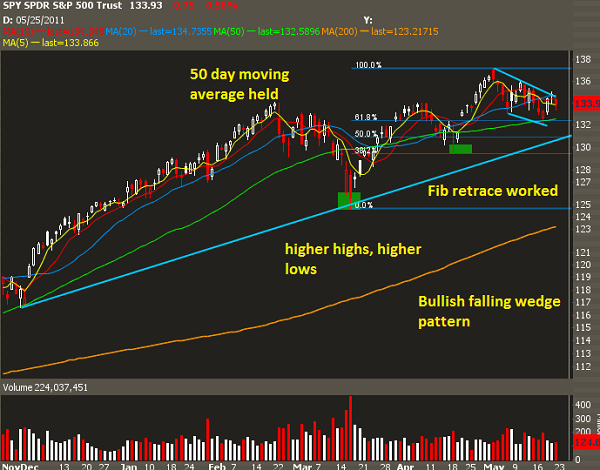
With that in mind, let's take a look at two possible interpretations of current market action in the SPX. What you see in the market is often reflective of your current positioning and confirmation bias, and if you are able to recognize this, you will become a better trader.
Daily SPY Chart, a Bearish View
Daily SPY Chart, a Bullish View
Which interpretation is the best one? Probably both or neither, which indicates the market has been in equillibrium as a battle of value has been going on. Odds are next week we will see a volatility expansion but to say we know with 100% certainy which direction it will take is hubris and is not good when managing risk.
Moral of the story? Have some nuance when reading the tea leaves, and be willing to admit that you were wrong.

