The purest form of technical analysis is identifying price areas where there will be a significant shift in either buyers or sellers (or both).
But there is an art to it-- how do you tell the difference between true S&R and what is noise?
This guide will show you these concepts through a totally different framework than you're used to.
How Support And Resistance Works
Stock charts are simply a way to view the action of all the order flow from market participants on the stock exchanges.
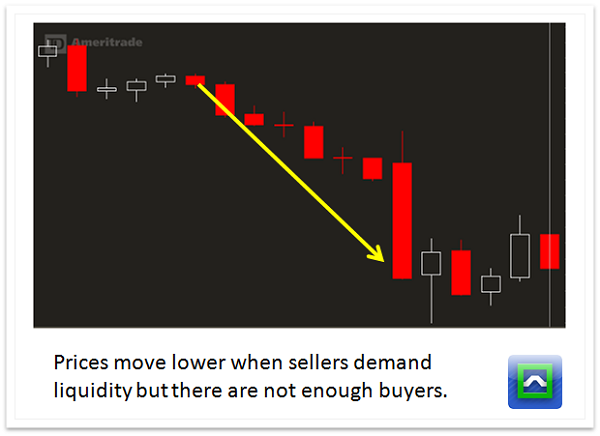
Order flow only occurs when liquidity is demanded from the system-- in other words, there must be market participants who are motivated enough to buy on the ask or sell on the bid, which puts them at a slight disadvantage in the short term.
If enough players are buying at the ask, price will rise.
If enough players are selling at the bid, price will fall.
Learn more about the concept of liquidity.
Support and resistance only occur when the demand for liquidity slows, stops or flips.
Why would prices stop moving?
The first thing that can happen is that those motivated partipiants simply no longer need to trade in the market.
The motivated sellers could have sold all their stock inventory and they have nothing left to sell...
Or the motivated buyers have allocated all the cash they are willing to and they aren't going to add to their inventory.
The second possible explanation is that price has moved enough where it has brought in more liquidity.
Prices can drop enough to entice buyers to step in, or the sellers are no longer willing to sell...
Or prices can rise fast enough to bring in those willing to take profits on their position, or nobody wants to buy because the stock has become too cheap.
This ebb and flow between buyers, sellers, and market prices forms the basis of Market Cycles.
The Kinds of Support and Resistance
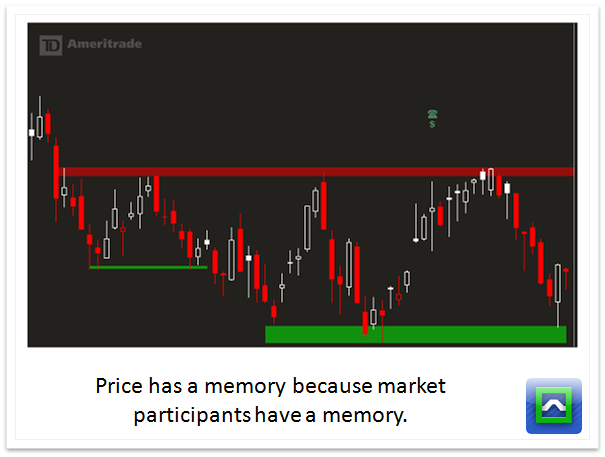
The purest form of S&R is the pivot level. By identifying areas where price was rejected in the past, you'll find key information about motivated market participants there.
The other "kinds" of support and resistance are mathematically based, not market structure based.
These analysis techniques are less powerful than pivot levels simply because it's an educated guess on where buyers and sellers might show up.
A good example of a mathematical support is a trendline. This is where you connect two separate pivot levels at different prices to determine levels in the future where price may trade.
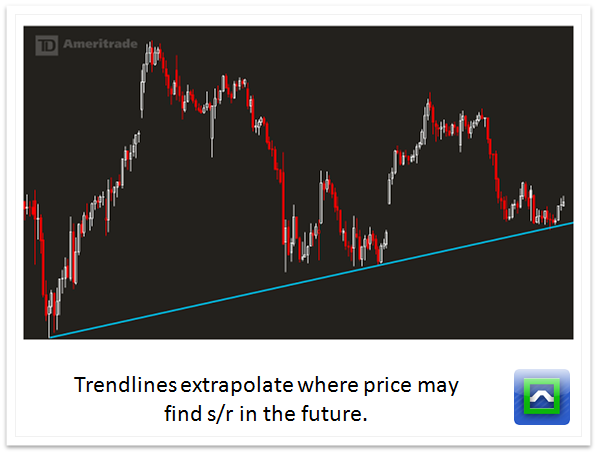
If pivot levels continue to rise or fall on a linear basis, then the trendlines will workout just fine. But there's no guarantee a trendline will work.
Let's say you are an institutional investor that wants to buy a stock at $55 a share. You don't look at charts, you look at company fundamentals and you feel that $55 a share is a fair price for the company given the earnings growth and the future cash flows.
The stock chart may show trendline support at $57, but our "motivated buyer" won't step up again unless the stock trades down to $55. That means the trendline will most likely fail and we head back to pivot support.
This is not to say that other support and resistance models can't work-- but you must recognize that these methods are not the holy grail setups that "should" work.
Other mathematical support and resistance techniques are moving averages, fibonacci retracements, measured moves, and whole numbers.
How to Trade Support and Resistance.
There are 4 total "kinds" of plays around support and resistance setups.
Reppellant Trades
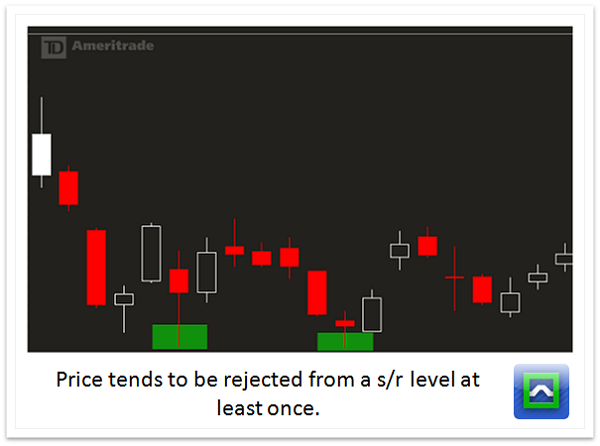
If price was rejected the last time it came into a level, odds are the second time it tests that level it will be rejected again. This is buying into support and selling into resistance. It's the basis for moving average pullback trades, double bottoms, double tops, and trendline plays.
Breakout Trades
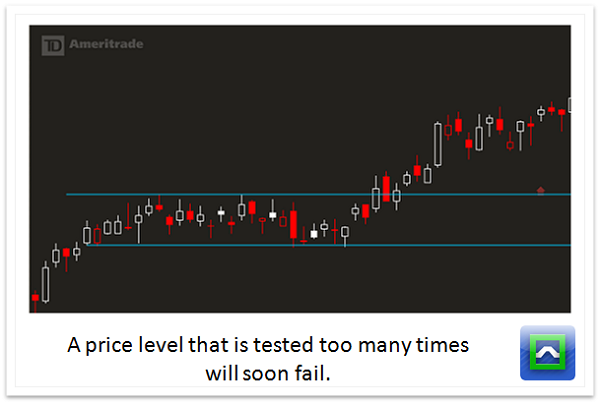
At some point, the liquidity that the market is offering at a certain price will disappear. If a support or resistance level is tested enough and with volume, it means that there are plenty of motivated players ready to move the stock. Continuation patterns like bull flags as well as simple compression breakouts fall into this category.
Magnet Trades
Flush Trades
Sometimes it's a Dice Roll