Staring at chart patterns can only take you so far. If you don't understand how actual trading takes place, then you'll be at a natural disadvantage to those that know the "dark arts."
What is the "Tape?"
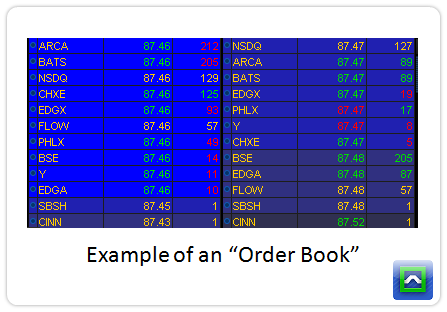
For me, reading the tape consists of two things: the printed orders, and the order book.
Understanding the relationship between the two is key.

The order book shows us the market participants that are providing liquidity to the market. Those that are willing to buy at a certain price are the bids, and those willing to sell at a certain price are the offers (or asks).
Each market participant has the price they are willing to pay, along with the size that they are willing to transact. The size is divided into lots of 100 shares, so a 5 lot would be equivalent to 500 shares.
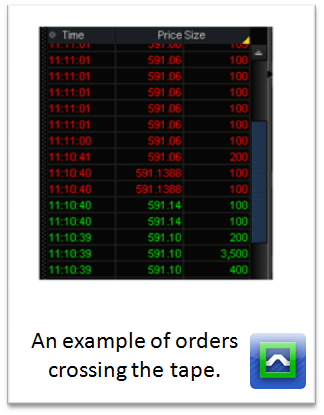
The next piece of the puzzle is the time and sales. These are the trades that actually "cross the tape."

Orders only cross the tape when a willing buyer is matched up with a willing seller, or the other way around.
That means if you place an order to buy at a lower price than what the market is pricing, there's no guarantee that you will find a willing seller. It's the same if you place an order to sell at a higher price than the market.
Because of this, there are plenty of "unfilled" orders that you can see on the order book. This is information that you won't see on a chart.
Take this example: a stock has been selling off hard after earnings, and sellers have been relentless in the stock. All of a sudden, and order to buy 10,000 shares hits the order book about 0.25 below what the current market price is. In response to this, algorithmic traders will start placing orders just above that bid price, and the sellers go away because they know that large order is much larger than them and it will be harder for the stock to get underneath that price.
If the large order never actually traded in the market, it still had an effect on price. That's the value of reading the tape.
Avoiding the Noise
In the age of algorithmic trading, there's a lot more noise on the tape than what their used to be.
In some ways, this is a good thing. If you're a pension fund and need to buy a bunch of shares, you can't just flash a massive buy order. You use algo strategies and things like iceberg orders to break up the size and sneak your way into a position.
In other ways, it's tougher as a discretionary trader to read the tape. There's a lot of "fake" orders that get cancelled, and a lot more stop runs by algorithmic strategies. Because it's such a fast market, where can you get signals from?
The first thing you can do is focus only on in play stocks. If a stock or market is moving really fast, the HFT's can't afford to front run your trades because they'll be taking much more risk in the market. That makes the tape a little truer for discretionary traders.

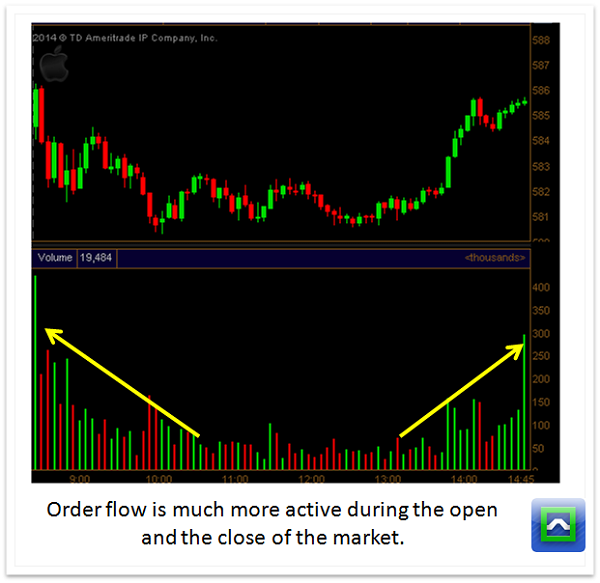
Second, focus on the order flow during the open and close of the market, so during the middle of the trading day there tend to be a lot more fakeouts.
Finally, avoid the stocks that have the HFT's involved. The best way to do that is to look at the overall float available to trade. Super high float stocks like AMD, BAC, and SIRI will be full of HFT's and the tape will be noise. But mid cap stocks with lower float will have more pure tape.
Basic Tape Reading Setups
There's 4 "kinds" of tape reading setups that I like to use.
Massive Order Book Size
If a market participant puts a huge order on the order book (but not at market prices) that often indicates a level of support.
There's two things that can happen. If traders keep hitting that order trying to take it down but the size remains the same, it means that there is probably a lot more size involved and you should look for price to slow down.
But if the size continues to get knocked down, it means that once the large order is eaten up the price will see continuation. This is called a "decrementing bid/offer" trade and is great for trending stocks.
Continuation Failures
If you see a ton of market orders that are hitting the ask, but the ask isn't lifting, it often indicates that there's some hidden size that is taking up all the liquidity.
Eventually all those who were buying at the ask will run out and price will have to auction lower. Once that happens, many who bought for continuation will get stopped out... and that becomes a better place to buy the stock instead of trying for the breakout.
Stop Runs
If there is a "captain obvious" level of support or resistance, you'll often see that level attacked only for it to reverse higher.
A great example is if an obvious support level is at 30.10, and the market is trading at 30.15, you'll see the bids disappear and drop down to 30.04. That means if you want to stop out, you'll incur a lot more slippage. If there are enough players getting stopped out, they'll be forced to sell lower than their stop. If you see a ton of selling hit just under that support level but the bid never drops, expect a pop back up above that resistance level.
Open Drive Continuation
After a news event like earnings or FDA announcements, a stock will only have so much liquidity supply available. Because of that, the bid/ask spread will widen out and those that want to get in or out quickly will be forced to really move price. Eventually that comes to an end that the stock consolidates in a range, but soon enough the demand for liquidity is so great that the stock will move. This is the basis for "flag" patterns in traditional technical analysis.
Example Trade: A "Decrementing Offer"
This trade setup is known as a decrementing offer. It happens when there has been a strong move higher in the stock, but a very large seller is "sitting on the offer." That means there is a good amount of size from a seller who is providing liquidity by placing a bunch of shares as a limit order on the market. You'll see it show up on the order book in the offer side.
The motivation of the seller is unknown. Sometimes it is a fund taking profits after a strong run, other times it is a large trader flashing size to scare away new buyers.
But if the demand for the stock is too great, you will see that order size continue to shrink.
And once this seller disappears, a pop often occurs in the stock.
The video below is a real time example in VHC. Be warned, there is some terrible electronic music in the background, but it is still a great example.