Some times... many times, there will be information missed out if you look at just the price of the market alone.
You'll need to look under the hood to get a feel for how the market is doing.
These indicators are called breadth indicators. They show us how the "market of stocks" is doing instead of the stock market.
Breadth indicators can often give you information about a market move before it happens. They can also show you divergences, where the markets are making a new move but don't have a ton of stocks participating in the move.
Take a look at these 5 breadth indicators and add them to your daily market analysis.
TICK Charts
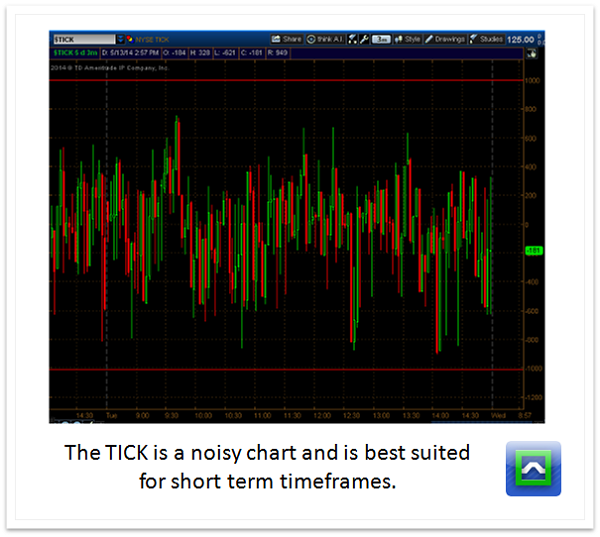
When a stock is bought at the offer, the stock "ticks" up on a chart. If a stock is sold at the bid, the stock "ticks" down.
These two things only happen when there is enough demand to move price one way or the other.
The TICK chart shows us how many stocks are being bought at the ask and sold at the bid.
If there is enough size trading in the market, you'll see the TICK hit extremes. +/- 1000 tends to indicate involvement by institutional players... those participants that have a lot of money to sling around.
TICK extremes can often indicate exhaustion of a buy program. But if the TICK persists at an extreme level for more than 10 minutes, it will indicate that the market may have a trend day, and fading the market is going to be much more risky than usual.
McClellan Oscillator
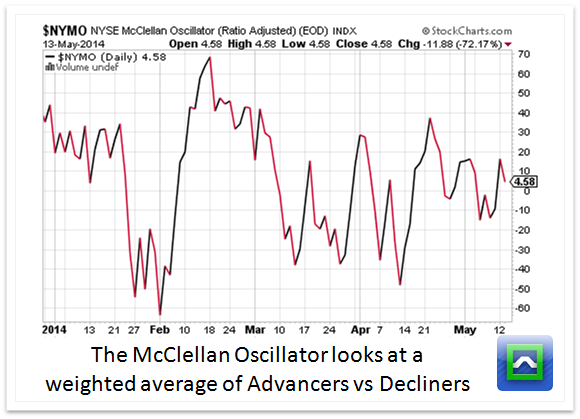
The McClellan Oscillator is just that-- an oscillator. The measurement is a bit complicated, and uses a ratio of the stocks advancing minus the stocks declining, and then uses two different weighted averages to arrive at the value.
This indicator is great for identifying extreme breadth both to the long side and the short side. One of the best "buy the dip" setups is when the markets are making a new relative low but the McClellan is making a new higher high.
NYSE A/D Line
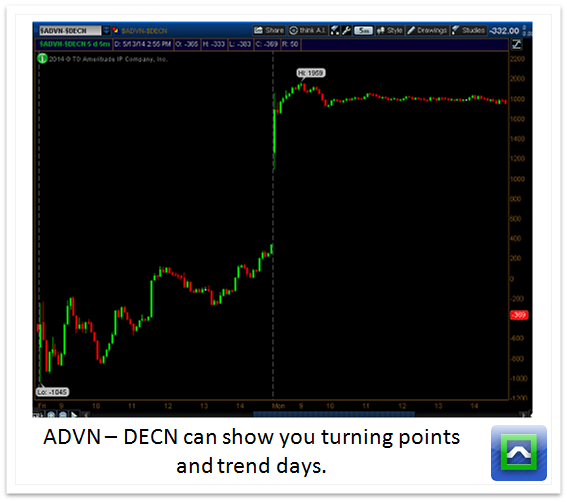
The A-D line is simply the difference of the amount of stocks that are going up minus the number of stocks going down. These readings are from NYSE stocks only.
This reading can help you to identify the characteristic of the markets very early in the day. If the A-D isn't at extreme levels during the first 30 minutes of trading, the day will probably be a little more trendless, and day trade strategies based on reversion will have a better win rate. But if the A-D stays super high or super low, it can indicate that a trend day is forming.
Cumulative A/D Line
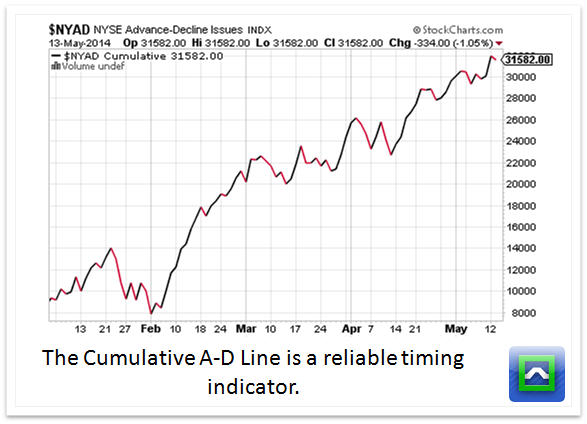
The NYAD takes the final reading of the A-D line for the day. Because this can be very noisy, the best way to look at this is to use a cumulative chart instead of a regular bar chart.
This is a great leading indicator of trend continuation. There are many times in which the markets have been rangebound, but the cumulative NYAD breaks out-- the market tends to breakout shortly after that.
SPXA50R
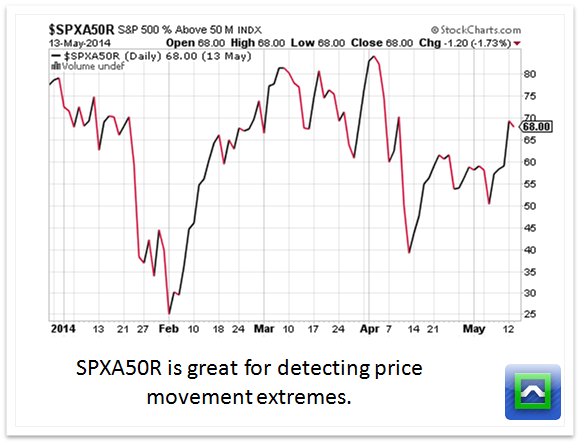
Looking at the total number of stocks that are above certain moving averages can give you longer term timing indicators. The SPXA50R is a great example-- it shows you the percentage of stocks in the S&P that are above their 50 day moving average.
High readings show us that the intermediate term rally is a little long in the tooth, although high readings can persist a little longer.
Oversold readings, anything under 30, can indicate that the selling is a little overdone and the market is due for a bounce.