Last week, Shopify (SHOP) had a nasty selloff, going from 120 to 100 over the course of just a few days.
The baddest short seller on the block, Citron Research, apparently thinks that Shopify is some giant scam.
Or something.
I like the company overall and this feels more like a bear raid to me... but where will the pain trade end? Let's take a look.
Key Support
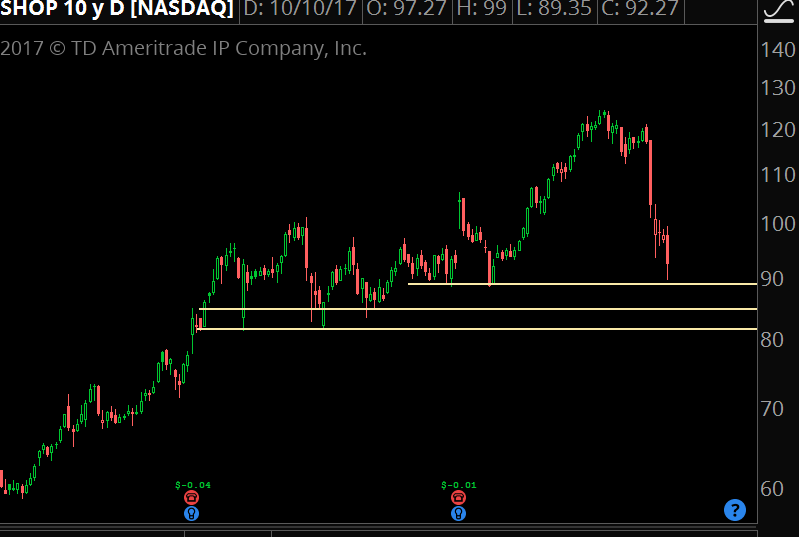
Before the most recent run from 100 to 120, the stock had been in a trading range for a few months. Top end of the range at about 100, bottom end of the range about 80. We'll use whole numbers to make it easy.
The first support is where buyers have already stepped in, at $90 per share. If that is lost, then we should expect the previous range lows, just above 80, to act as the next support.
Now let's put some statistics behind it...
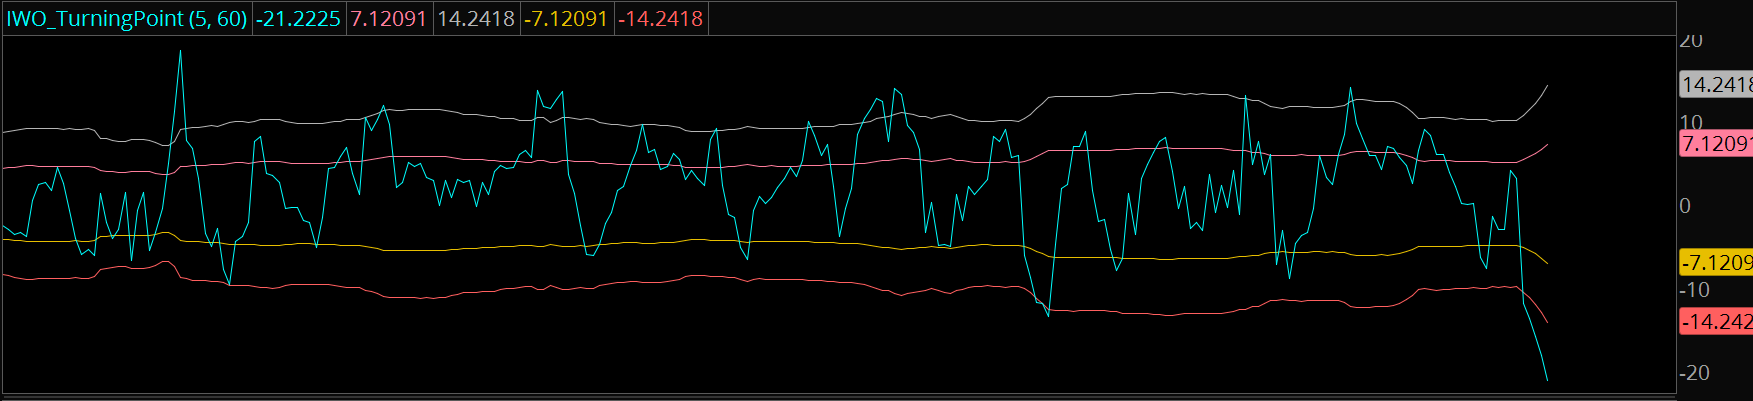
Find the Stock Turning Point
The IWO Turning Point Indicator is a great tool to see what kind of changes you should expect relative to the past volatility.
Here is the indicator over 3 different timeframes.
5 Day
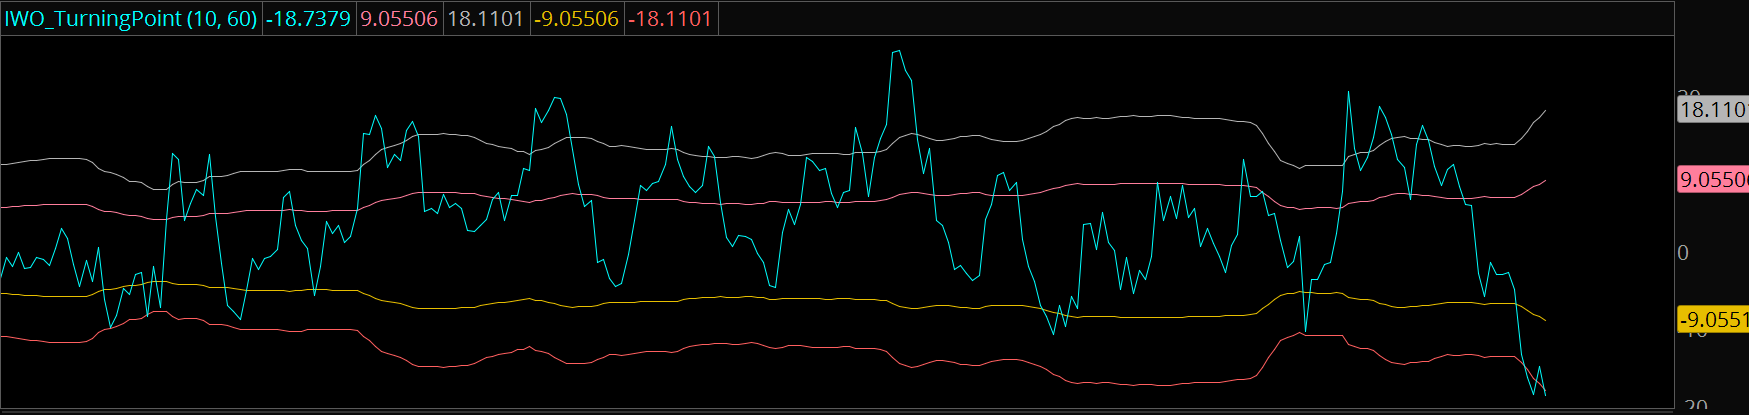
2 Weeks
1 Month
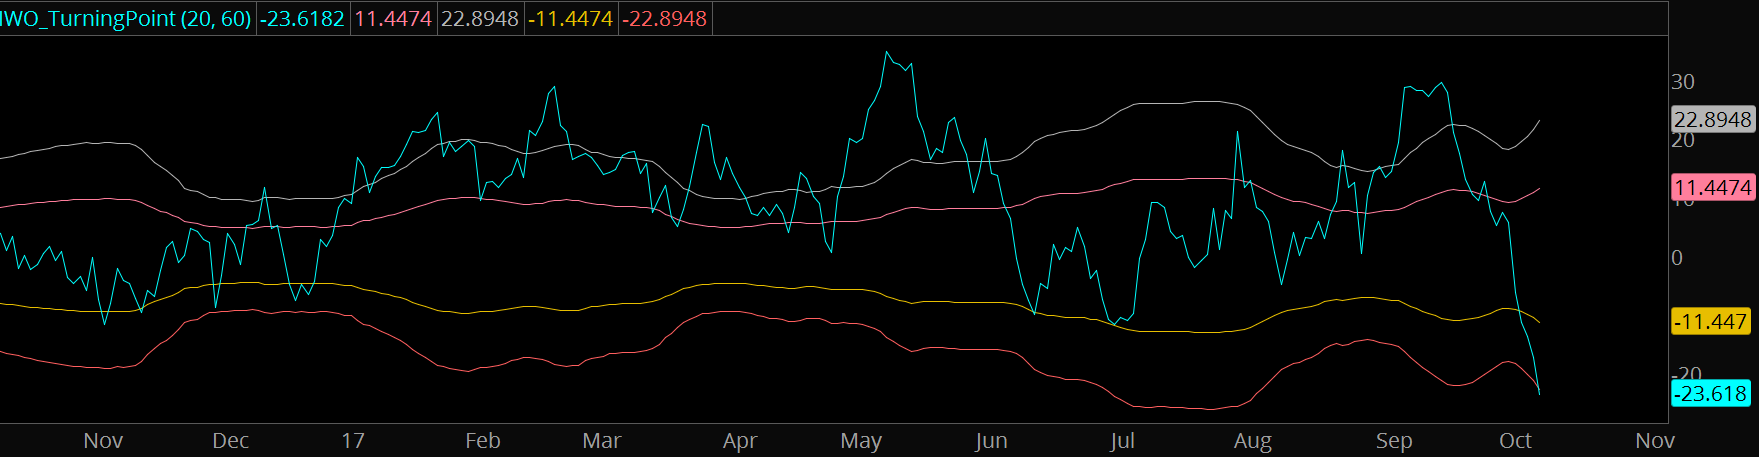
On all three major timeframes, this is selling that hasn't happened save for one other time... when the stock broke down under its IPO support at the beginning of 2016. Back then, the stock was trading under 20, and in about 2 years it ran 600%.
Simply put, the stock hasn't seen anything like this. It's still a new stock and this is the first "bad news" since the massive run it's had.
Let's say for a moment that -20% is the short term floor... and that we had another 20% drop in just a little while.
20% off current prices ($92 per share) would put the stock at $73, about $7 under where the obvious support is.
What is the option market pricing right now?
Earnings Risk
The 3Nov17 $93.50 straddle is going for about 14 bucks... that means the market is expecting another $14 of movement between now and the first month of November.
Why are we looking at this in particular? Because these options have earnings risk priced into them. That's $14 of expected movement, or about 15%.
Now we know using the IWO Turning Point Indicator that a 20% selloff hasn't happened before, and while it could happen again, much of that risk is already being priced into the market.
My Gut Feeling
Here's what I think when you put it all together...
This was a "layup" for Citron. The stock had rallied another 20% and there were a lot of "blind breakout" buyers who had their stops run.
Price action right now feels like more investors are taking profits or getting stopped out, and many investors are also thinking hard as to what kind of size they want to hold through earnings, especially after the fact that the stock had moved hard from the past few quarters.
This feels like a "buy the news" event. The selloff, for now, is more technical in nature and driven by stop losses rather than the fundamentals of the company. Selling put spreads here can be a good risk/reward into any more blood, if you're willing to hold them through earnings.
There is a possibility that the company doesn't recover. We've seen many momentum names have that one nasty selloff that completely changes the character of the stock. GPRO comes to mind.
Yet I don't think that's what we are seeing... at least for now. We've got a good risk/reward with holding some conservative long plays through earnings.
Get the Turning Point Indicator
This custom trading indicator helps you to identify profitable turning points in a stock and gives you a better context to how far and fast we've moved.
This indicator is available for Thinkorswim and TradingView.