What a Move!
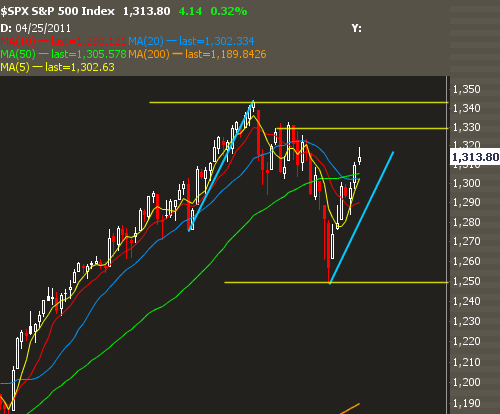
After retesting the year's open around SPX 1250, the market has made back nearly all of its gains for the year, and it did so with such a strong bounce. This price action smacks of the "regret trade" pattern, where a move lower shakes everyone out, no retail traders "buy the dip," and then everyone is forced to chase at poorer risk return levels.
Comparing the Moves
Much of the market weakness we saw in February and March can be attributed to news-based risk out of North Africa and Japan, so it's interesting to see exactly how price is acting compared to the nasty down day on January 28th as we saw a flight out of equities due to Egypt news. Let's look at the chart:
So the bounce back that we've seen off the March lows is of the same magnitude as the Egypt lows to the 52-week highs. We can also see that the time that it took the markets to get off the mat was a much shorter timeframe. This makes sense, as we have seen much more market volatility relative to January.
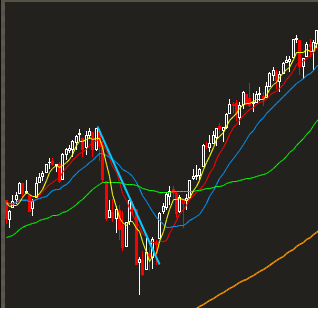
So through this analog this level becomes just another resistance area, which may or may not hold price here. In my opinion it's structurally healthy for the market to chop for a bit as new setups appear, but we've seen in the past how resistance levels are shown no respect whatsoever. Take last year's pullback (January 2010) for instance:
That blue line is the same magnitude as the pullback we just had, and we then saw no resistance levels shown respect as we ran all the way through April's levels.
If you were to say that this year's price action would be similar to last year's, the template has fit, so far.

