The post earnings run in AMZN has been tremendous. After a month of consolidation, the stock is nearing 400 after a solid 1 week run.
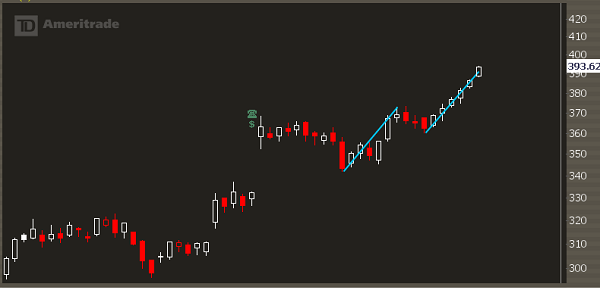
However, on top of this run, the stock is putting in a parabolic short pattern.
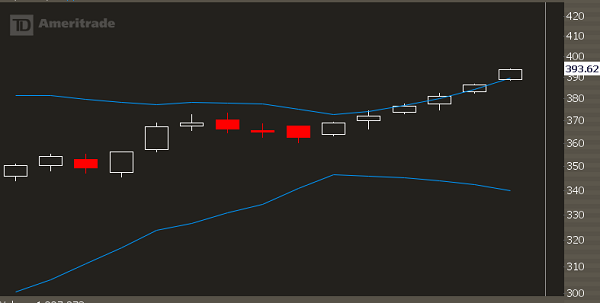
I look for two things with this pattern:
1. A close above the 2nd standard deviation Bollinger Band
2. A gap higher above that close
These two conditions suggest that buying pressure is reaching extreme levels, and that the odds of further stock movement continue to decrease.
We are seeing that setup right now in AMZN:
Now does this mean that a long term top is going to happen right now? Probably not. You've gotta respect the momentum and how 400 is a big psychological magnet.
But I am looking at some short delta opportunities. Not necessarily long puts, but something that will profit if the stock pulls back and retraces the past week's action, but not much more.